Presentation to the Financial Community FY 2009 Results February 2010
Forward-Looking Statements Forward-looking statements are based on a number of assumptions and expectations that could ultimately prove inaccurate, as they are subject to risks and variables, outside the companys control, that could…
Presentation Outline FY 2009 Financial Results Oil & Gas Industry Market Outlook Saipem in 2010: Resilient despite Recession Backlog Analysis Offshore Example Onshore Example Drilling Example 2010 Guidance Beyond 2010:…
FY 2009 Financial Results 4
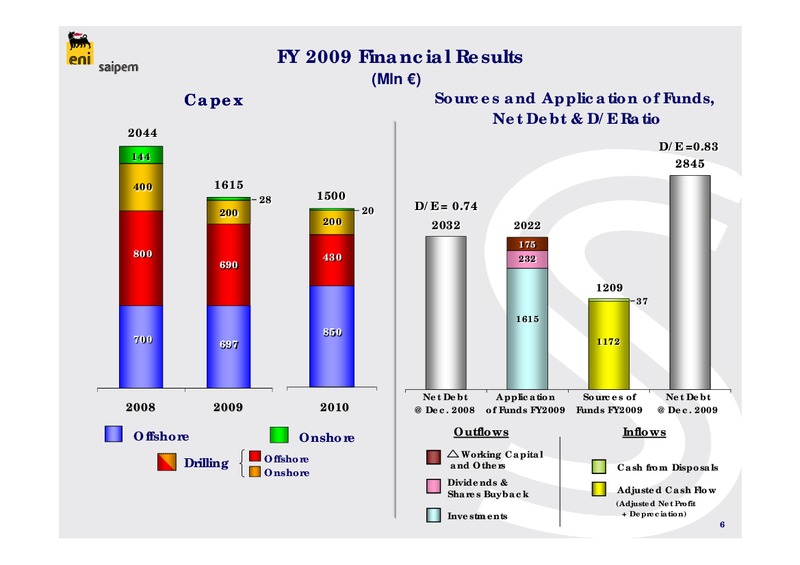
FY 2009 Financial Results (Mln ) Revenues EBITDA EBIT Net Profit 10094 10292 Adjusted 1596 % on Revenues 1156 % on 1436 % on 1083 % on Revenues Revenues Revenues 338 (7.0%) 4831 290 (6.0%) 5324 352 (6.6%) 303 (5.7%) 732 161…
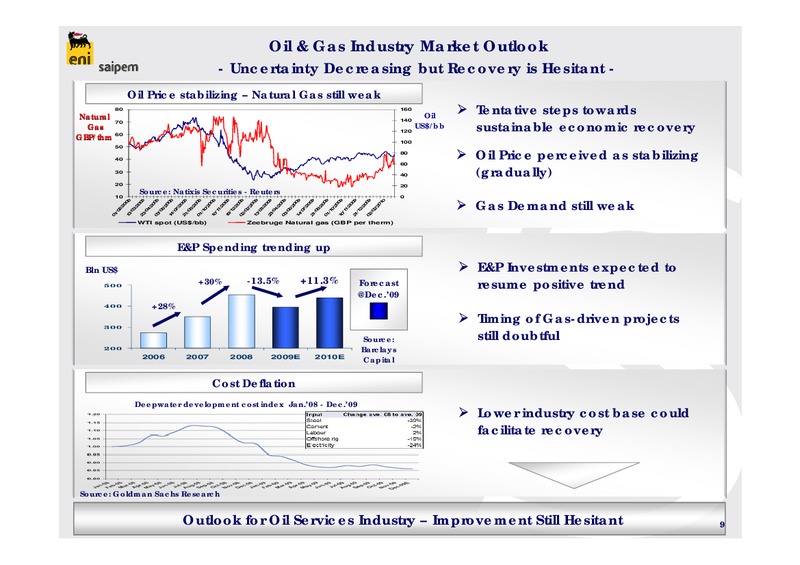
Oil & Gas Industry Market Outlook - Uncertainty Decreasing but Recovery is Hesitant - Oil Price stabilizing Natural Gas still weak Natural 80 160 Oil Tentative steps towards sustainable economic recovery 140 US/bb 70 Gas 120…
Oil & Gas Industry Market Outlook - Downturn Impact Timing: Oil Companies Vs. Oil Services - (Immediate) (Delayed) Oil Companies* Net Income Aggregate Net Income 120 60% YoY ( Bln) 100 44% 40% %Growth/ 80 20% /Decrease 60 6% 0%…
Saipem in 2010: Resilient despite Recession 11
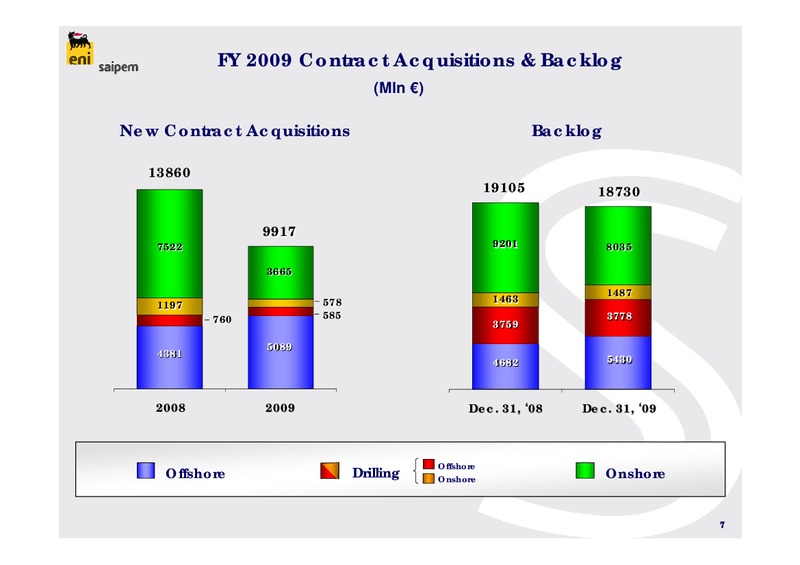
Saipem in 2010: Resilient despite Recession Backlog: Remarkable Mix of Quality and Quantity Bln Backlog 9.9 10.3 Backlog Dec. 31, '08 Dec. 31, '09 19.1 18.7 Bln Bln 2009 New Contract Acquisitions Revenues Saipem Exposure…
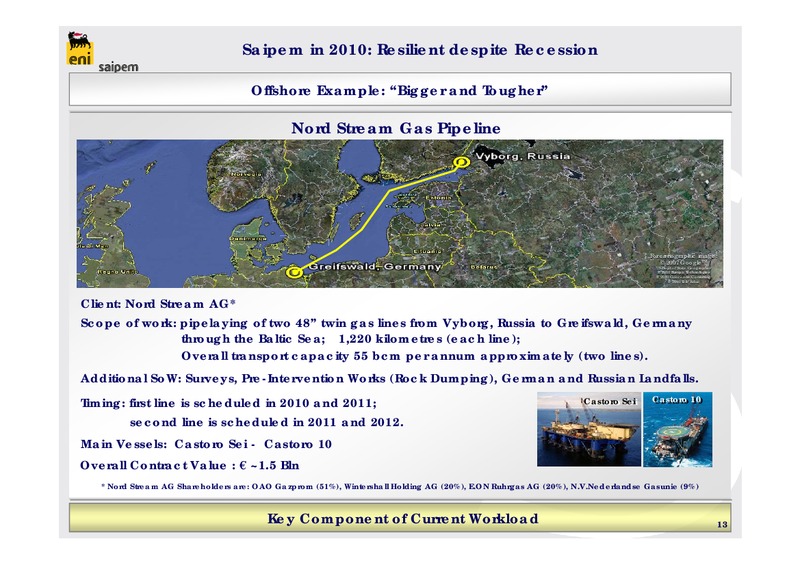
Saipem in 2010: Resilient despite Recession Offshore Example: Bigger and Tougher Nord Stream Gas Pipeline For cartographic image: 2007 GoogleTMTM US US Dept Dept of of State State Geographer Geographer 2010 2010…
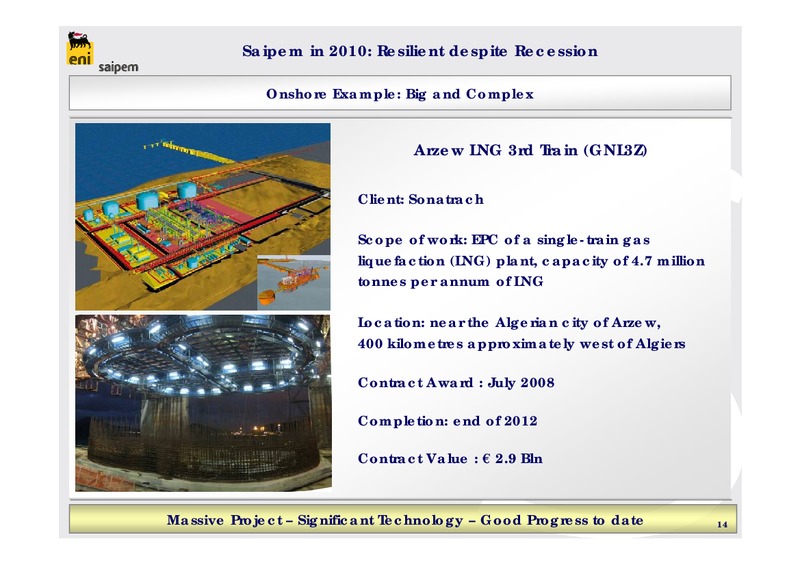
Saipem in 2010: Resilient despite Recession Onshore Example: Big and Complex Arzew LNG 3rd Train (GNL3Z) Client: Sonatrach Scope of work: EPC of a single-train gas liquefaction (LNG) plant, capacity of 4.7 million tonnes per…
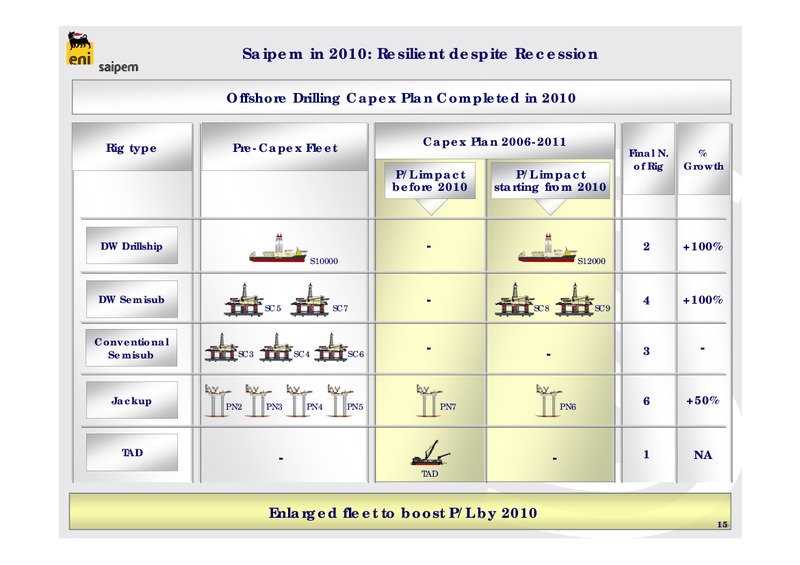
Saipem in 2010: Resilient despite Recession Offshore Drilling Capex Plan Completed in 2010 Rig type Pre-Capex Fleet Capex Plan 2006-2011 Final N. % of Rig Growth P/L impact P/L impact before 2010 starting from 2010 DW…
Saipem in 2010: Resilient despite Recession 2010 Guidance Revenues Maintained (some variation in BU mix) Higher EBITDA Increased Depreciation, mainly in Drilling EBIT Maintained Capex 1.5 Bln 16
Beyond 2010: Benefiting from Capex Plan 17
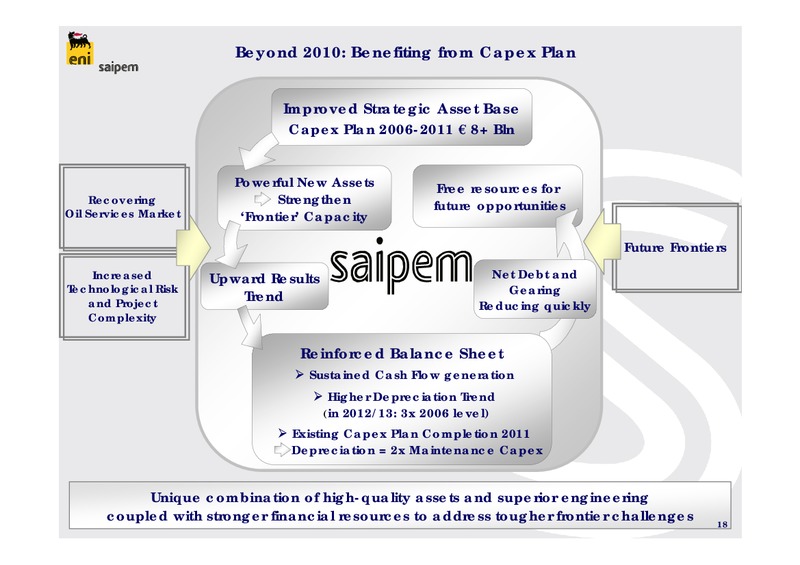
Beyond 2010: Benefiting from Capex Plan Improved Strategic Asset Base Capex Plan 2006-2011 8+ Bln Powerful New Assets Free resources for Recovering Strengthen future opportunities Oil Services Market Frontier Capacity Future…
Conclusions 19
Conclusions Oil Price perceived as stabilizing: gradual resumption of E&P Capex Positive Trend Gas Demand still weak: may affect timing of gas-driven projects Context Downturn/Recovery Bottom Line Impact Different Timing: Oil…
 Loading...