Annual Report 2014 25 February 2015 - Conference call 9.30am CET webcast available at www.maersk.com
page 3 Strategic Highlights 2014 We have created value and strengthened our competitive positions. We shared the value creation through increased dividends and our first share buy-back Major portfolio optimisation initiatives…
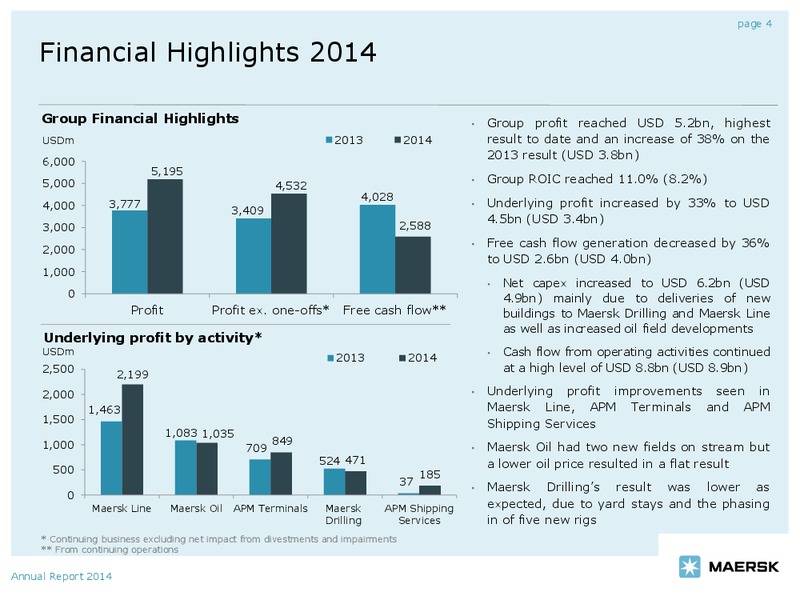
page 4 Financial Highlights 2014 Group Financial Highlights Group profit reached USD 5.2bn, highest USDm 2013 2014 result to date and an increase of 38% on the 6,000 2013 result (USD 3.8bn) 5,195 5,000 Group ROIC reached 11.0%…
page 5 Financial Highlights Q4 2014 Group Financial Highlights The Group increased the underlying profit USDm Q4 2013 Q4 2014 for Q4 by 68% to USD 1bn mainly driven 1,400 by strong performance in Maersk Line 1,200 1,025 The Group…
page 6 APMM to divest the 20% ownership stake in Danske Bank and to dividend the proceeds of around USD 5.5bn* out as cash A.P. Mller Mrsk (APMM) has today announced the plan to distribute the value of its 20% ownership share in…
page 7 Maersk Line results Q4 Q4 FY FY (USD million) 2014 2013 2014 2013 Highlights Q4 2014 Revenue 6,912 6,450 27,351 26,196 Maersk Line delivered a profit of USD 655m, the strongest fourth quarter to date and more than double…
page 8 Delivering further cost reductions Unit cost including VSA income (USD/FFE) Highlights Q4 2014 3,200 3,092 3,097 Total cost increased by 1.9% (USD 116m) 3,012 3,010 against a volume increase of 9.8% 3,000 2,871 2,742…
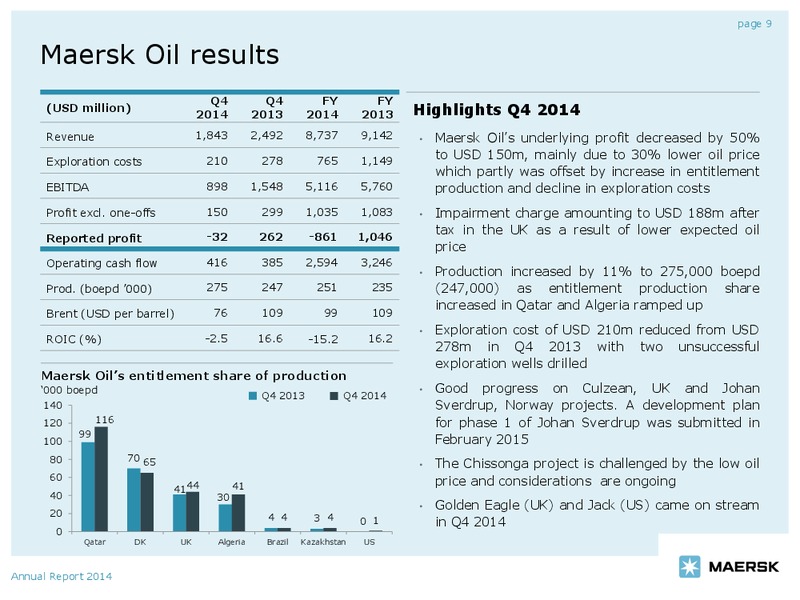
page 10 Adapting to lower oil price The Al Shaheen field, Qatar OPEX Double-digit percentage cut on Maersk Oils OPEX level Production portfolio reviewed with potential impact on high opex fields and wells Negotiating terms…
page 11 APM Terminals results Q4 Q4 FY FY 2014 2013 2014 2013 Highlights Q4 2014 Revenue 1,124 1,102 4,455 4,332 Profit decreased to USD 117m (USD 222m) due EBITDA 229 231 1,010 892 to an impairment of USD 102m after tax related…
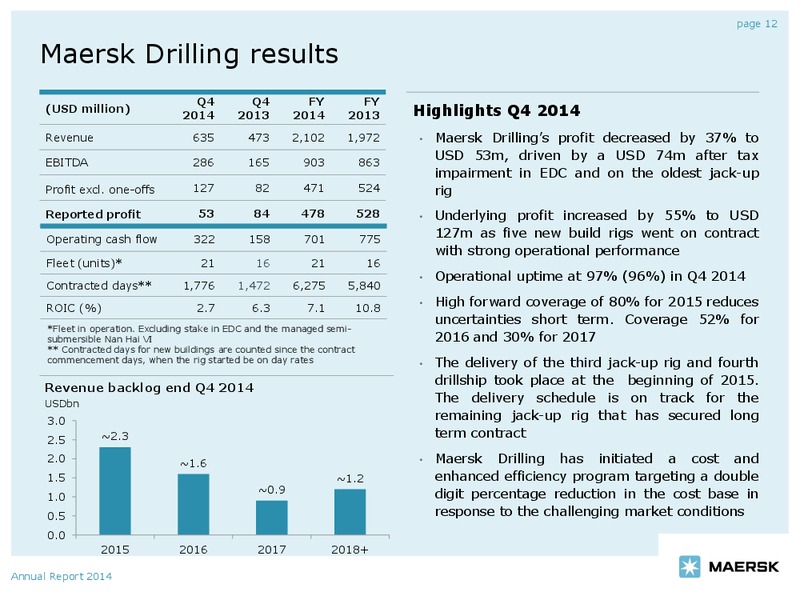
page 12 Maersk Drilling results Q4 Q4 FY FY (USD million) 2014 2013 2014 2013 Highlights Q4 2014 Revenue 635 473 2,102 1,972 Maersk Drillings profit decreased by 37% to USD 53m, driven by a USD 74m after tax EBITDA 286 165 903…
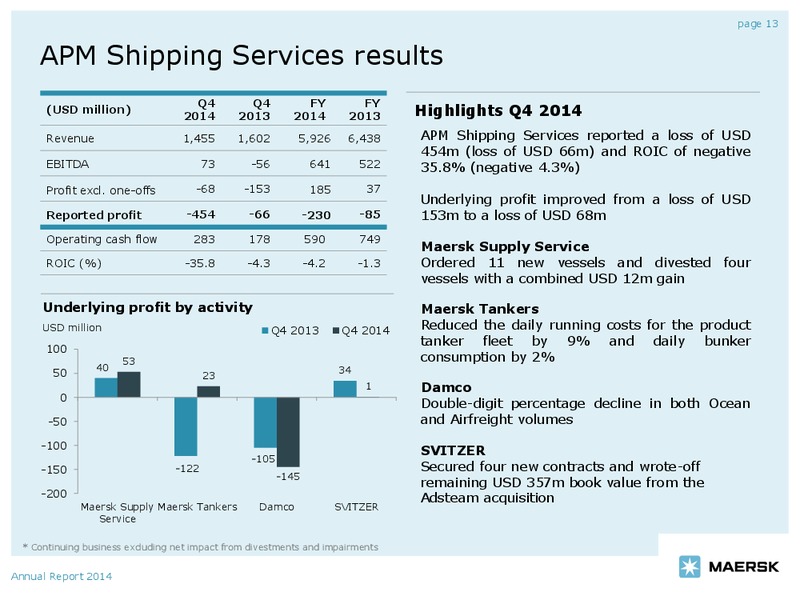
page 13 APM Shipping Services results Q4 Q4 FY FY (USD million) 2014 2013 2014 2013 Highlights Q4 2014 Revenue 1,455 1,602 5,926 6,438 APM Shipping Services reported a loss of USD 454m (loss of USD 66m) and ROIC of negative…
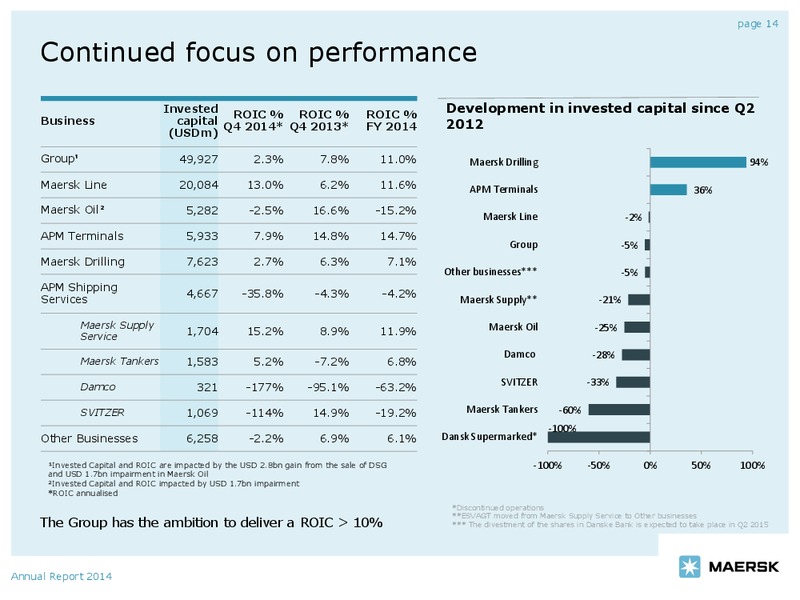
page 14 Continued focus on performance Invested ROIC % ROIC % ROIC % Development in invested capital since Q2 Business capital 2012 Q4 2014* Q4 2013* FY 2014 (USDm) Group 49,927 2.3% 7.8% 11.0% Maersk Drilling 94% Maersk…
page 15 A strong financial framework Well capitalised position Active portfolio management Net debt reduction of USD 3.9bn since Q4 2013 and USD 7.6bn Cash flow from divestments has been USD 11.3bn with divestment since Q4 2011…
page 17 Guidance for 2015 The Group expects an underlying result slightly below APM Shipping Services expects the underlying result for USD 4bn (USD 4.1bn) excluding Danske Bank. Gross cash 2015 to be above the 2014 result (USD…
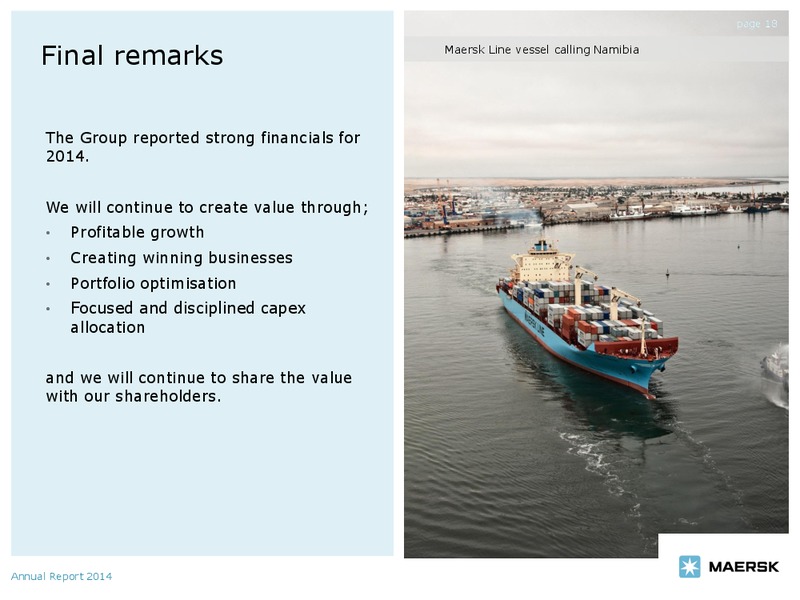
page 18 Final remarks Maersk Line vessel calling Namibia The Group reported strong financials for 2014. We will continue to create value through; Profitable growth Creating winning businesses Portfolio optimisation…
 Loading...