Dresser-Rand Group Inc. p Pritchard Capital Energize g 2012 Conference The Westin Market Street in San Francisco January 5, 2012
Global Supplier of Energy Infrastructure Solutions 2010 revenues 2 billion from energy infrastructure and oil field spending on new equipment and aftermarket parts and services Acquired Grupo Guascor May 2011 gas & diesel engine…
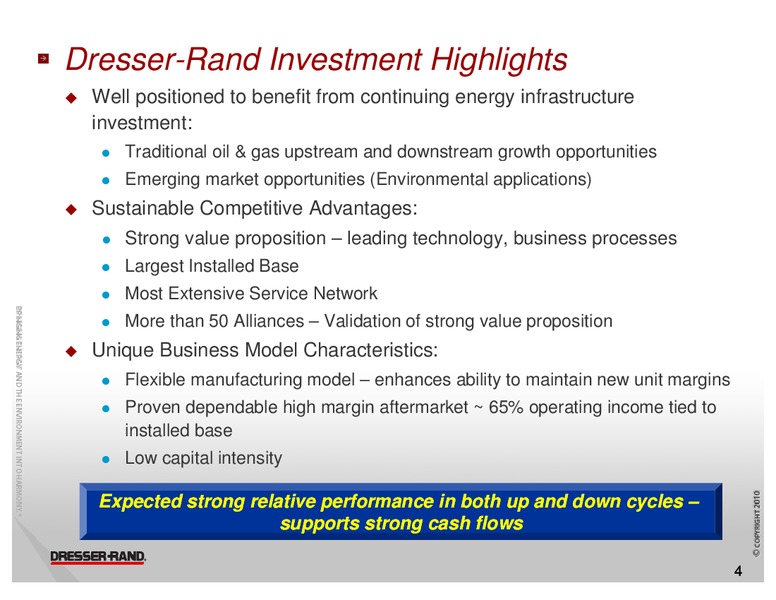
Dresser-Rand Investment Highlights Well positioned to benefit from continuing energy infrastructure investment: Traditional oil & g gas upstream p and downstream g growth opportunities pp Emerging market opportunities…
We Serve Energy Infrastructure Worldwide Upstream Midstream Downstream Environmental 2011 Estimated N New U Unit it 60% 9% 10% 17% Bookings Hydrocracking Biomass (pic Reinjection Gas pipeline above) Gas lift transmission Fluid…
New Units Growing Market Opportunities Anticipated Source: Dresser-Rand 6
Floating Production Opportunities 130 Projects Over 5 Years ( 25,000 MMSCFD in aggregate) North Sea North America 9 Projects including Europe 16 Projects Kaskida, Samurai including Dana, Fram, and Hadrian North Golden Eagle,…
Refining Opportunities to 2016 Planned Oil Refinery Market Oil Refinery Capacity Share 2016 % Planned Oil Refinery South & Central America 1.6 Market Regional Refinery Capacity Addition, MMBPD, 2011-2016 North America 0.3…
Environmental Segment - CAES Opportunities Dresser-Rand has 20 years of successful Compressed Air Energy Storage (CAES) Only operating installation in North America Extensive renewable deployment is the primary reason for the…
Infrastructure Investments Driving New Unit Bookings Growth ( in Millions) Growth drivers: 2,000 Population growth Economic growth Energy demand growth 1,500 Initiatives: Value selling 1,000 Localization R&D ICS (Statoil Joint…
Aftermarket Expanding Market Opportunities Anticipated Gas Turbine Repair 44 4% 44.4% Market Expansion of traditional services + New Offerings Source: Dresser- Dresser-Rand; note Client Spend included in the categories…
Dependable High Margin Aftermarket Revenues ( in Millions) 9% CAGR 2000 to 2010 1,500 Since 05 IPO through 9/11: Added 21 Service & Support New leadership team Implemented growth strategy Centers 1,000 Acquired 9 companies Key…
Business Model Designed to Support Strong Financial Performance in Both Up p and Down Cycles y Strong Financial Performance Result: Significant Free Cash Flow Low Capital Intensity NWC as a % of sales averaged 1.6% 20062010…
Net Debt to Capital at End of Period ( in Millions)) 60% 56% Increased leverage from: 47% 47% Guascor acquisition (5/11) 45% Share S a e repurchases epu c ases (505) 34% 32% Total debt 1,066 21% Sr. Sub. Notes - 375 20% 14%…
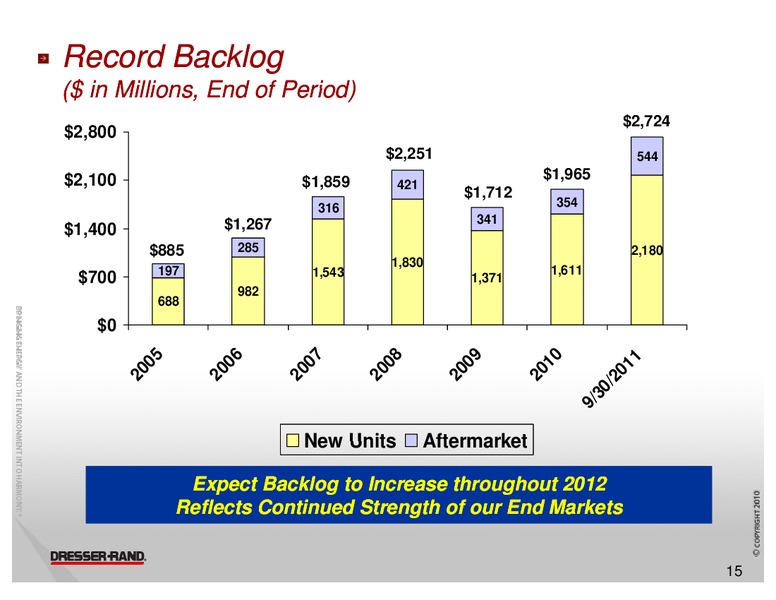
Record Backlog ( in Millions Millions, End of Period) 2,724 2,800 2,251 544 2,100 1,859 1,965 421 1,712 316 354 1,267 341 1 400 1,400 885 285 2,180 1,830 197 1,543 1,611 700 1,371 982 688 0 05 06 07 08…
 Loading...