Company Profile Pure Play in Deepwater Offshore Market Significant Operating Leverage Vertically Integrated, Low Cost Manufacturer Increasing Manufacturing Capacity Consistent Track Record of New Product Innovation Highly…
Selected Highlights
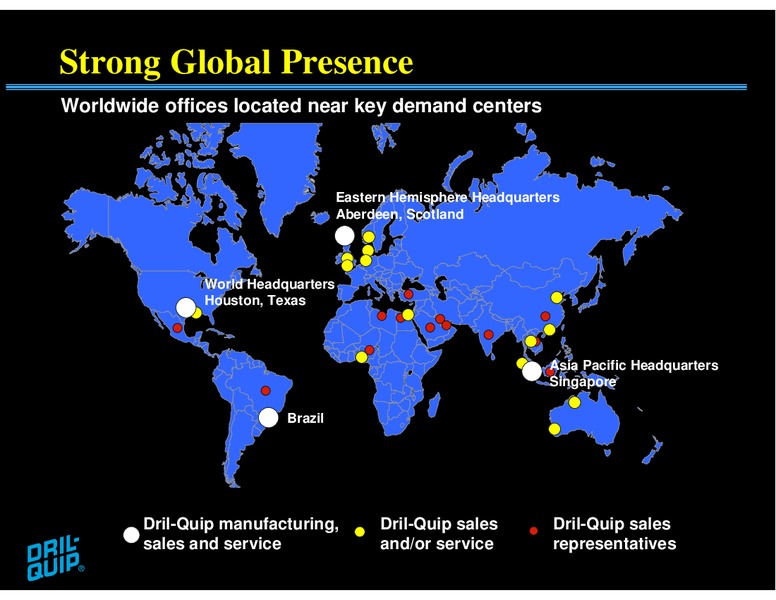
Strong Global Presence Worldwide offices located near key demand centers Eastern Hemisphere Headquarters Aberdeen, Scotland World Headquarters Houston, Texas Asia Pacific Headquarters Singapore Brazil Dril-Quip…
Proven Track Record of Profitability Net Income Net Income Margin * (mm) (%) 125 25 107.9 105.6 105.1 21.8 19.6 19.5 19.5 100 86.9 20 75 15 9.6 50 10 32.6 25 5 0 0 2005 2006 2007 2008 2009 2005 2006 2007 2008 2009 *…
Condensed Consolidated Statements of Income Year Ended December 31, (Millions of USD) 2008 2009 Revenues 542.8 540.2 Cost and Expenses: Cost of sales 57.5% 312.3 57.4% 310.3 S, G & A expenses 62.4 60.7 Engineering expenses 26.4…
Condensed Consolidated Statements of Income Three Months Ended March31, (Millions of USD) 2009 2010 Revenues 127.5 142.5 Cost and Expenses: Cost of sales 56.5% 72.0 57.4% 81.8 S, G & A expenses 14.5 13.4 Engineering expenses 6.3…
Condensed Consolidated Balance Sheets (Millions of USD) Dec. 31, Dec. 31, Assets 2008 2009 Current assets 514 617 Property, plant and equipment, net 166 200 Total assets 680 817 Liabilities and Stockholders Equity Current liabilities…
Condensed Consolidated Balance Sheets (Millions of USD) Dec. 31, March 31, Assets 2009 2010 Current assets 617 631 Property, plant and equipment, net 195 195 Other assets 5 10 Total assets 817 836 Liabilities and Stockholders Equity…
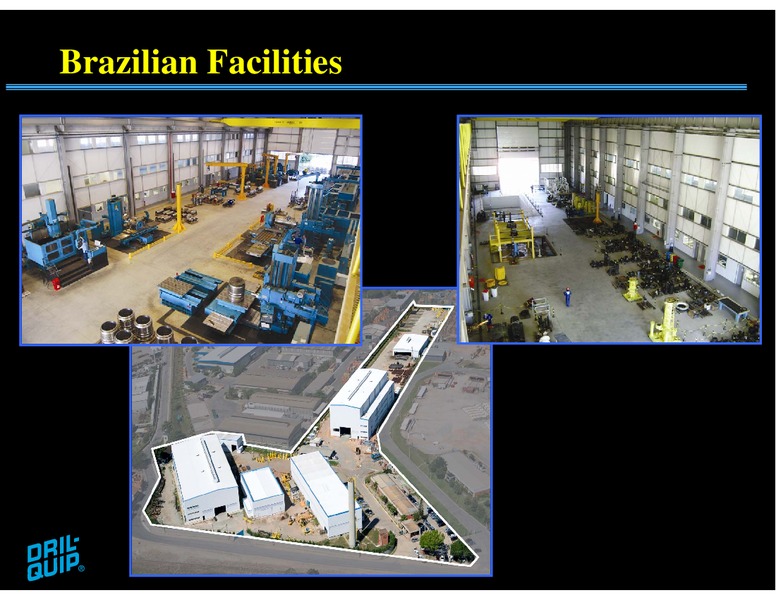
Facilities Expansion Houston Adding machines both new & rebuilt Increasing forging capability Added Subsea Controls and Service buildings Brazil Construction complete on new buildings Space available to increase machine capacity…
Houston Eldridge Manufacturing Facility
Forge / Heat Treat
Houston Finish Machine Shop
Brazilian Facilities
Singapore Facilities
Future Revenues will be influenced by: Market conditions Pricing Product mix Increased number of machines Increased number of machinists
Prior Manufacturing Capacity Actual Actual Dec. 2008 Dec. 2009 Machines 224 239 Ratio 1.38 1.36 Machinists 310 325
Planned Machines & Possible Machinists Dec. 2010 Dec. 2011 Planned Machines 247 262 Realistic Ratio 1.60 1.60 Possible Machinists 396 420
Product and Services Summary 100% Internally Developed Products; 16 New Products over 28 Years Subsea Surface Offshore Rig Equipment Equipment Equipment Subsea Wellheads Surface Wellheads Wellhead Connectors Mudline Suspension…
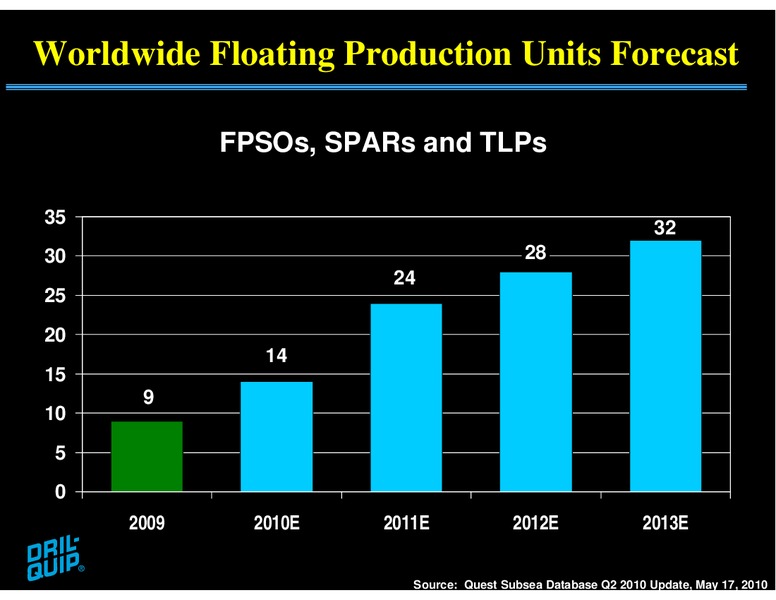
Worldwide Floating Production Units Forecast FPSOs, SPARs and TLPs 35 32 30 28 24 25 20 14 15 9 10 5 0 2009 2010E 2011E 2012E 2013E Source: Quest Subsea Database Q2 2010 Update, May 17, 2010
Worldwide Subsea Tree Forecast Subsea Tree Awards Forecast Base Case 600 489 458 450 382 319 310 300 150 2009 2010E 2011E 2012E 2013E Source: Quest Subsea Forecast Awards, May 17, 2010
Looking Ahead Focus on deepwater offshore sector Continue capacity expansion Increase market share of all products Continue introduction of new products Maintain strong financial condition
 Loading...