Executive Summary ( in millions, except per share data) Three Months Ended Nine Months Ended 9/30/2013 9/30/2012 6/30/2013 9/30/2013 9/30/2012 Revenues 220 217 232 650 644 Gross profit: Operating 69 69 67 191 191 32% 32% 29% 29%…
Executive Summary Q3 2013 earnings of 0.42 per diluted share compared with 0.26 per diluted share in Q2 2013 o 15.6 million gain on the sale of the Express in July 2013 o 8.6 million loss on the early extinguishment of debt associated…
Executive Summary Balance sheet o Cash and cash equivalents decreased to 480 million at 09/30/2013 from 514 million at 06/30/2013 58 million milestone payment for Q5000 made in July 2013 69 million down payment under Q7000 shipyard…
Operational Highlights 8
Contracting Services ( in millions, except percentages) Three Months Ended 84% utilization for the Well 9/30/2013 9/30/2012 6/30/2013 Intervention fleet Revenues (A) Skandi Constructor fully functional in well intervention Well…
Contracting Services Well Ops GOM Q4000 fully utilized during Q3 IRS no. 2 on hire for the remainder of 2013 Helix 534 now expected to commence operating in the Gulf of Mexico in late December with full backlog in 2014, and extending…
Contracting Services Robotics 98% chartered vessel utilization in Q3 o Five vessels under long-term charter with the addition of the REM Installer during the quarter 68% utilization for ROVs, trenchers, and ROVDrill Awarded 5-year…
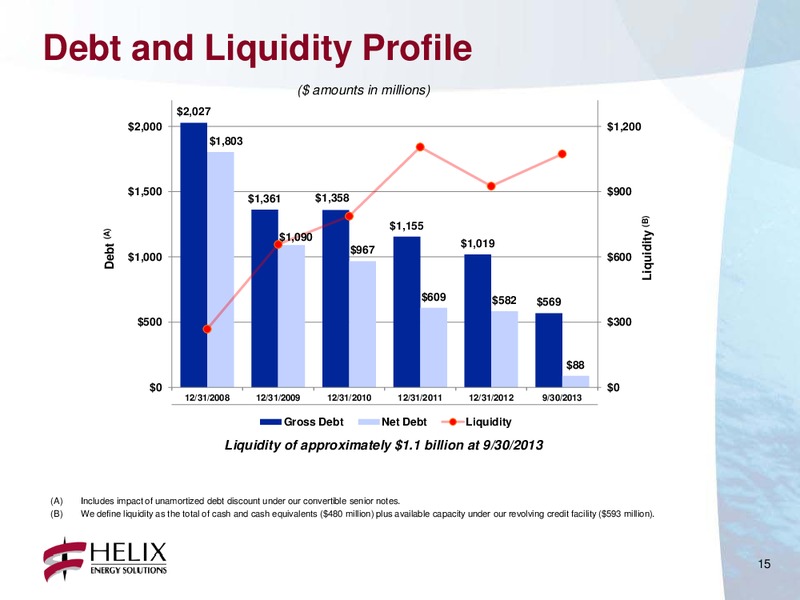
Debt Maturity Profile Total funded debt of 596 million at end of Q3 2013: Maturity Profile at 9/30/2013 ( amounts in millions) 200 million Convertible Senior Notes 3.25% (A) 200 500 (172 million net of unamortized debt discount)…
2013 Outlook ( in millions) 2013 2012 Outlook Actual Revenues (on-going operations) 800 654 (A) EBITDA 290 601 EBITDA - 2013 Exit Rate (B) 350 -- (B) CAPEX 400 492 Revenue Split: Well Intervention 449 379 Robotics 318 329…
2013 Outlook Contracting Services o Backlog as of September 30, 2013 was approximately 1.8 billion o Utilization expected to remain strong for the well intervention fleet Q4000 backlog through 2015; negotiations on-going to extend…
2013 Outlook Capex Capital Expenditures o Contracting Services (approximately 400 million in 2013) 176 million incurred in Q3, 298 million year to date 58 million milestone payment for Q5000 made in July 2013 69 million down payment…
Non-GAAP Reconciliations 20
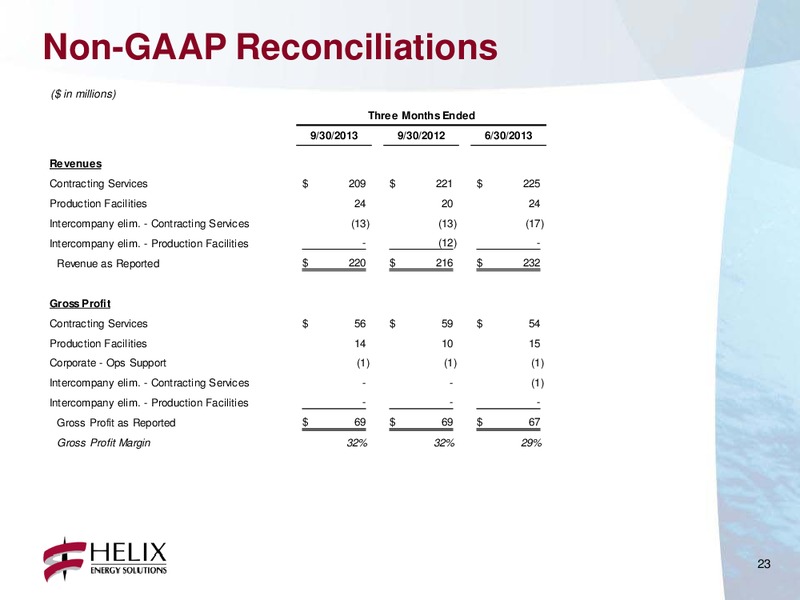
Non-GAAP Reconciliations ( in millions) Three Months Ended Nine Months Ended 9/30/2013 9/30/2012 6/30/2013 9/30/2013 9/30/2012 Net income from continuing operations 45 11 28 75 32 Adjustments: Income tax provision (benefit) 7 1 9 16…
Non-GAAP Reconciliations ( in millions) Reconciliation of Adjusted EBITDAX from discontinued operations: Three Months Ended Nine Months Ended 9/30/2013 9/30/2012 6/30/2013 9/30/2013 9/30/2012 Net income (loss) from discontinued…
 Loading...