Earnings Presentation Second Quarter and Half Year 2011 August 10, 2011 12:00 noon UK time
Highlights Strong financial performance for the quarter reflects increased activity levels, improved utilisation and strong operational performance on large projects in their offshore phase Improvement in the North Sea, although…
Key priorities We remain focused on key markets with long-term, strong and sustainable growth characteristics; where we can differentiate ourselves, markets where we can achieve profitable growth Our key priorities: Safety &…
Key priorities: Ongoing fleet enhancement BUILD Delivered H1 2011 Expected delivery H1 2012 RELEASE DIVEST / Returned to owner post charter Divested CHARTER BP 3-year LoF US GoM STL 5-year LoF North Sea *Oleg…
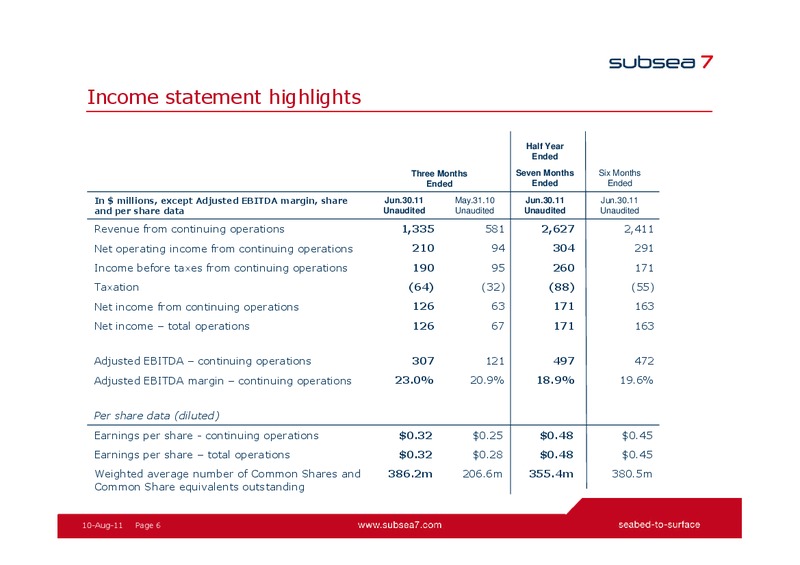
Income statement highlights Half Year Ended Three Months Seven Months Six Months Ended Ended Ended In millions, except Adjusted EBITDA margin, share Jun.30.11 May.31.10 Jun.30.11 Jun.30.11 and per share data Unaudited Unaudited…
Operational performance Q2 2011 523m 3 0 8 m 308m 45m ( 8m) ( 8 m) Reven ue NOI Revenue NOI 614m 41m 308m 11m 155m 151m ( 8m) 17m Revenue NOI 10-Aug-11 Page 7
Income statement overview Q2 2011 Administrative expenses of 97 million, included 15 million of integration costs All joint ventures performed well Investment income of 4 million reflected interest received on cash balances Other…
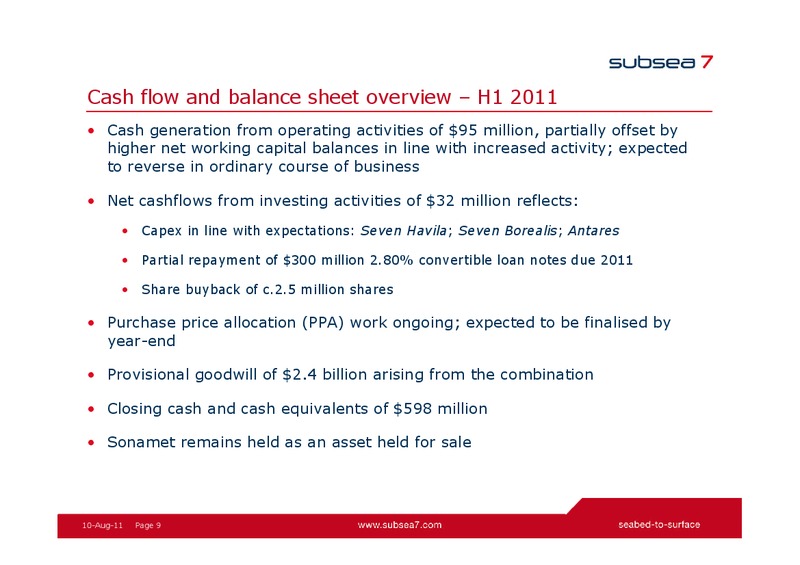
Cash flow and balance sheet overview H1 2011 Cash generation from operating activities of 95 million, partially offset by higher net working capital balances in line with increased activity; expected to reverse in ordinary course of…
2011 financial assumptions Current assumptions: Administrative expenses: c.75 million per quarter for remainder of 2011, excluding integration costs but synergies starting to materialise Integration costs: 26 million expensed in H1…
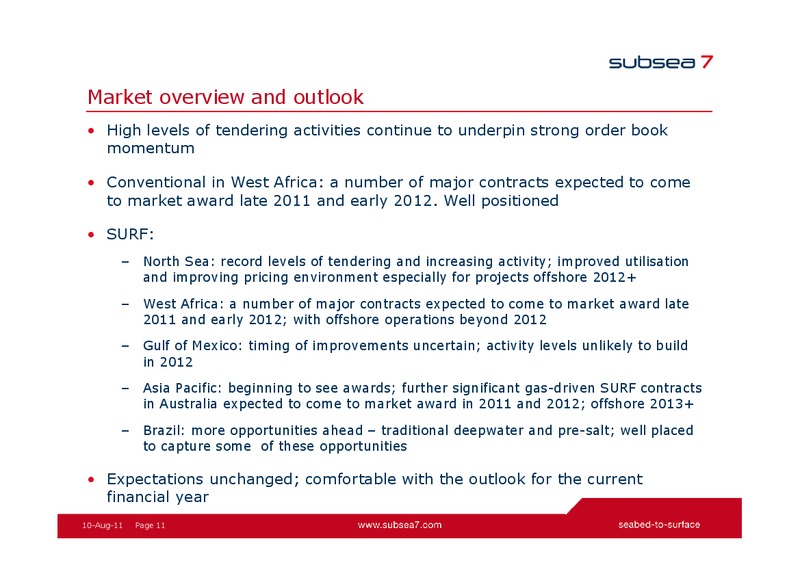
Market overview and outlook High levels of tendering activities continue to underpin strong order book momentum Conventional in West Africa: a number of major contracts expected to come to market award late 2011 and early 2012. Well…
Summary Approaching the future with confidence Opportunities in nearly all our markets with increasing activity; albeit at different pace in different geographical areas Market fundamentals are very good Well positioned to…
Appendix 11-May-11 Page 13
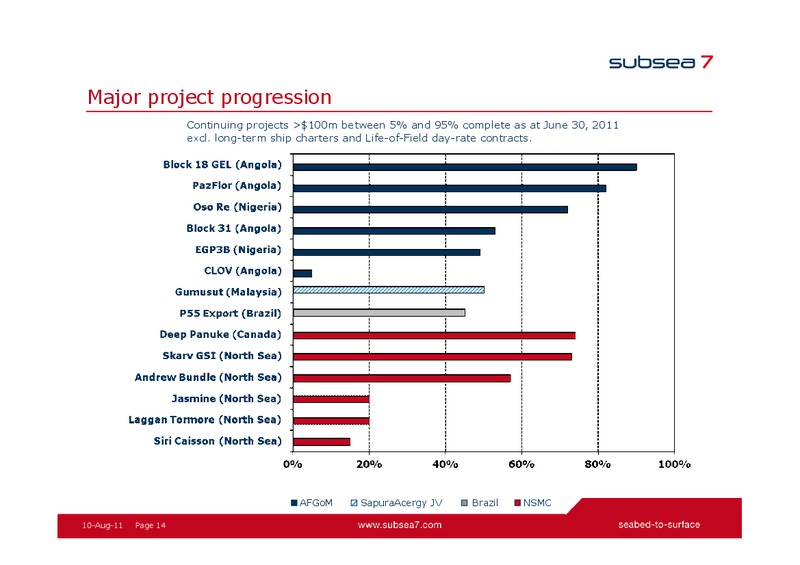
Major project progression Continuing projects 100m between 5% and 95% complete as at June 30, 2011 excl. long-term ship charters and Life-of-Field day-rate contracts. AFGoM SapuraAcergy JV Brazil NSMC 10-Aug-11 Page 14
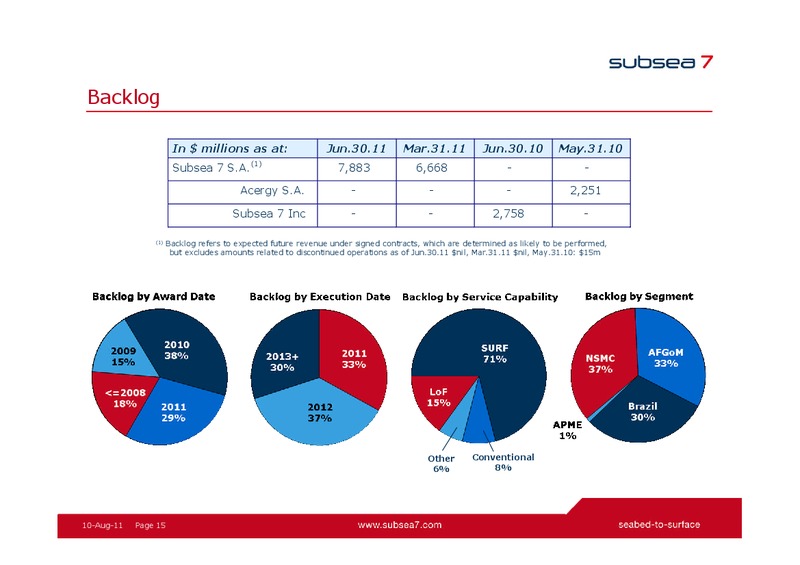
Backlog In millions as at: Jun.30.11 Mar.31.11 Jun.30.10 May.31.10 (1) Subsea 7 S.A. 7,883 6,668 - - Acergy S.A. - - - 2,251 Subsea 7 Inc - - 2,758 - (1) Backlog refers to expected future revenue under signed contracts, which…
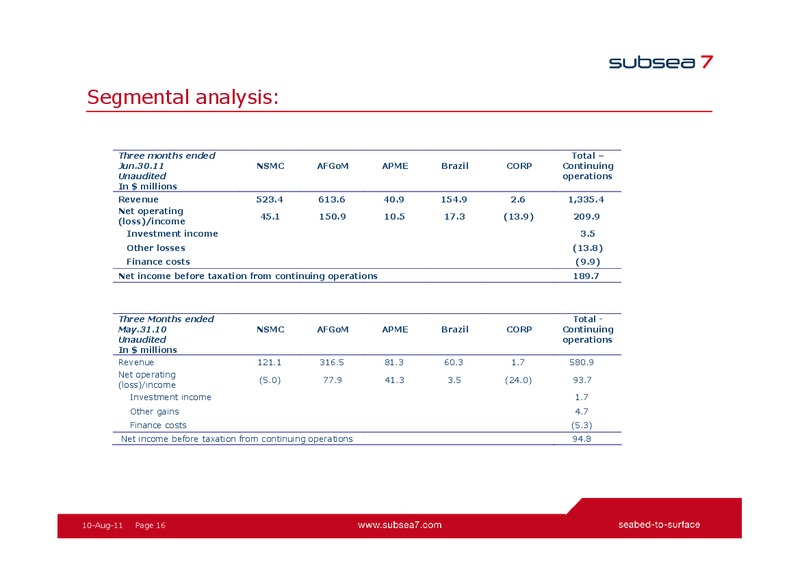
Segmental analysis: Three months ended Total Jun.30.11 NSMC AFGoM APME Brazil CORP Continuing Unaudited operations In millions Revenue 523.4 613.6 40.9 154.9 2.6 1,335.4 Net operating 45.1 150.9 10.5 17.3 (13.9) 209.9…
Segmental analysis: Seven months ended Total Jun.30.11 NSMC AFGoM APME Brazil CORP Continuing Unaudited operations In millions Revenue 831.2 1,338.7 104.8 345.5 6.9 2,627.1 Net operating 37.6 268.9 12.3 21.1 (35.7) 304.2…
Adjusted EBITDA The Group calculates adjusted earnings before interest, income taxation, depreciation and amortisation (Adjusted EBITDA) from continuing operations as net income from continuing operations plus finance costs, other…
Reconciliation of net operating income to Adjusted EBITDA Three Months Ended Three Months Ended Jun.30.11 May.31.10 Total Total In millions (except percentages) Continuing Discontinued Continuing Discontinued operations operations…
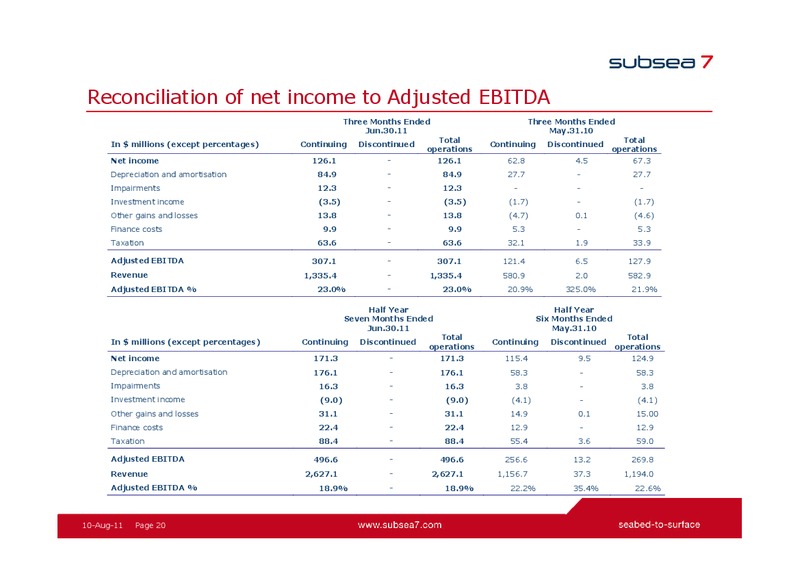
Reconciliation of net income to Adjusted EBITDA Three Months Ended Three Months Ended Jun.30.11 May.31.10 Total Total In millions (except percentages) Continuing Discontinued Continuing Discontinued operations operations Net income…
 Loading...