Fourth Quarter & Full Year 2011 Earnings Call March 20, 2012
About U.S. Silica Foundation dating back over 111 years Headquartered in Frederick, MD Offices in Houston, TX and Chicago, IL Thirteen strategic production facilities Two business segments Industrial & Specialty Products…
2011 Achievements Full Year Fourth Quarter Sales Revenue Contribution Margin Sales Revenue Contribution Margin (in millions) (in millions) (in millions) (in millions) 20.7% YOY Growth 35.4% YOY Growth 40.5% YOY Growth 63.9% YOY…
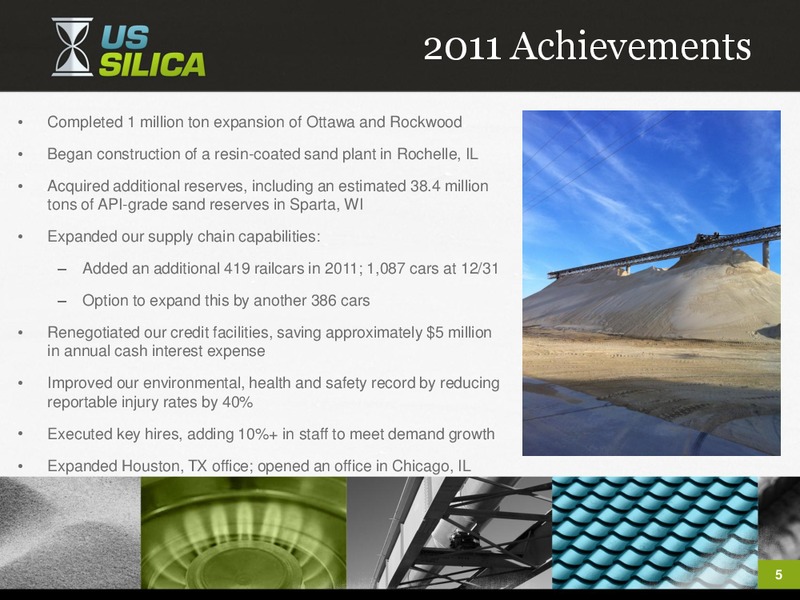
2011 Achievements Completed 1 million ton expansion of Ottawa and Rockwood Began construction of a resin-coated sand plant in Rochelle, IL Acquired additional reserves, including an estimated 38.4 million tons of API-grade sand…
Market Update Natural Gas prices fell dramatically throughout 2011 and further in early 2012 Decline has driven producers to redeploy resources to liquids-rich basins Migration has resulted in timing issues, but also increased…
Operational Advantages Vast reserves of premium quality sand acquired at much lower prices than are currently available Operating efficiencies due to proximity of mining activity to production facilities Operational and…
Outlook Increase our frac sand capacity by 60% in 2012 to meet the continued increase in demand for our raw sand proppants Complete construction of a new resin-coated sand facility capable of coating up to 400 million pounds…
2011 Fourth Quarter and Full Year Financial Results ( in millions except statistics and per share) Three Months Ended Year Ended December 31, December 31, 2011 2010 2011 2010 Key Operating Statistics: Tons Sold: (000s) Oil & Gas…
Cash Flow and Liquidity Net cash from operations was 42.6 million for the full year 2011, compared to 36.7 million for the full year 2010 Increase driven primarily by a 23.7 million improvement in pre-tax earnings Partially offset…
Capital Spending Capital expenditures in 2011 totaled 66.7 million 8.0 million for the Sparta land acquisition (4.0 million of which was financed through a short-term note) Investment of 38.2 million for expansion of our Ottawa,…
2012 First Quarter and Full Year Guidance We currently estimate for First Quarter 2012 : Revenue 92 97 million Adjusted EBITDA* 34 36 million We currently estimate for Full Year 2012 : Revenue 395 420 million Adjusted EBITDA*…
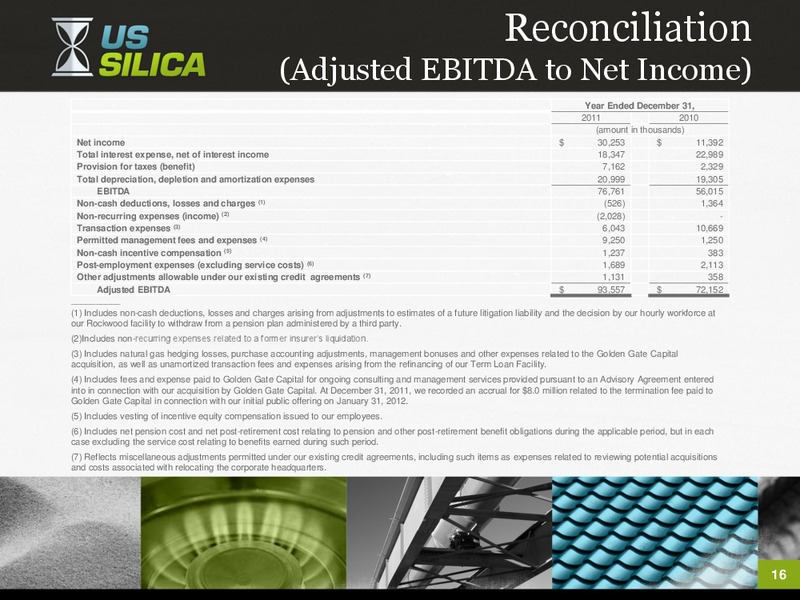
Reconciliation (Adjusted EBITDA to Net Income) Year Ended December 31, 2011 2010 (amount in thousands) Net income 30,253 11,392 Total interest expense, net of interest income 18,347 22,989 Provision for taxes (benefit) 7,162…
 Loading...