Skip to main content34TH ANNUAL RAYMOND JAMES INSTITUTIONAL INVESTORS CONFERENCE – Superior Energy Services, Inc. Investor Presentation | Shale Experts
Superior Energy Services 34th Annual Raymond James Institutional Investors Conference March 5, 2013
Company Overview
Rationale for Superior Diversified family of products Serving the drilling, completion, production and decommissioning needs of the oil and gas industry in the U.S. with a growing presence in select international markets Globally…
4
Balanced Contribution from Diversified Product Mix 2012 Revenue by Segment 2012 Income from Operations by Segment 4,568.1 million 706.5 million Onshore Onshore Completion Subsea and Subsea and Completion and Technical…
Revenue Exposure by Geographic Market Area 2012 Segment revenue by major geographic location as a percentage of total revenue ( in millions) Gulf of U.S. Land International Mexico Drilling Products and Services 341 (7%) 242…
Participate in 90 billion of Global Market Segments SPN Rank Drilling Products and Services (1) 3rd Onshore Completion and Workover Services Well Servicing 4th Estimated 600,000 HHP Pressure Pumping 11th at year end 2012…
Business Model Yields Strong Relative Performance SPN vs. Selected OFS Peers : EBITDA Margin Analysis 32% 31.0% 30.1% 29.7% 30% 28.2% 28% SPN 26.1% 26% HAL 24.6% EBITDA Margins 24% SLB 22% BHI 20% BAS 18% KEG…
Strategic Overview
Strategy Execution: U.S. Land Markets Near-Term Outlook Anticipate utilization of completion assets to increase as 2013 progresses; pricing slower to recover Oil development continues to drive activity; natural gas needs demand…
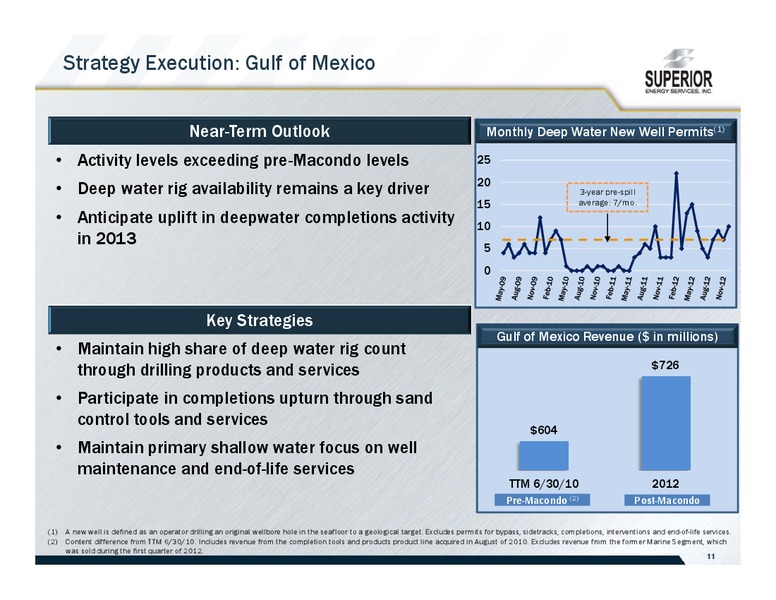
Strategy Execution: Gulf of Mexico Near-Term Outlook Monthly Deep Water New Well Permits(1) Activity levels exceeding pre-Macondo levels 25 20 Deep water rig availability remains a key driver 3-year pre-spill 15 average: 7/mo.…
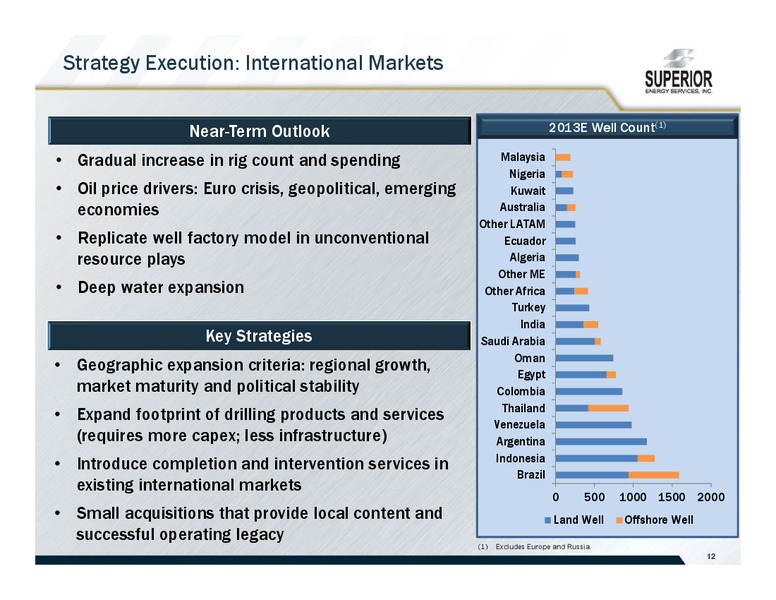
Strategy Execution: International Markets Near-Term Outlook 2013E Well Count(1) Gradual increase in rig count and spending Malaysia Nigeria Oil price drivers: Euro crisis, geopolitical, emerging Kuwait economies Australia Other…
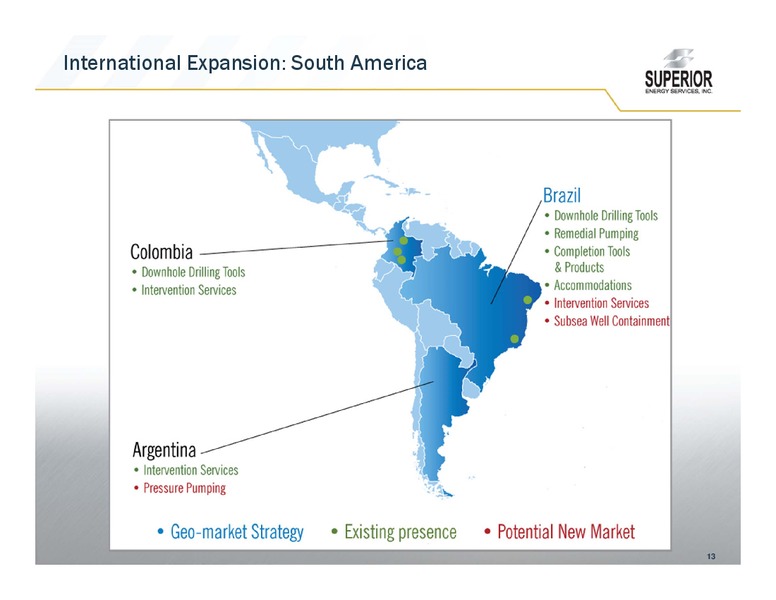
International Expansion: South America 13
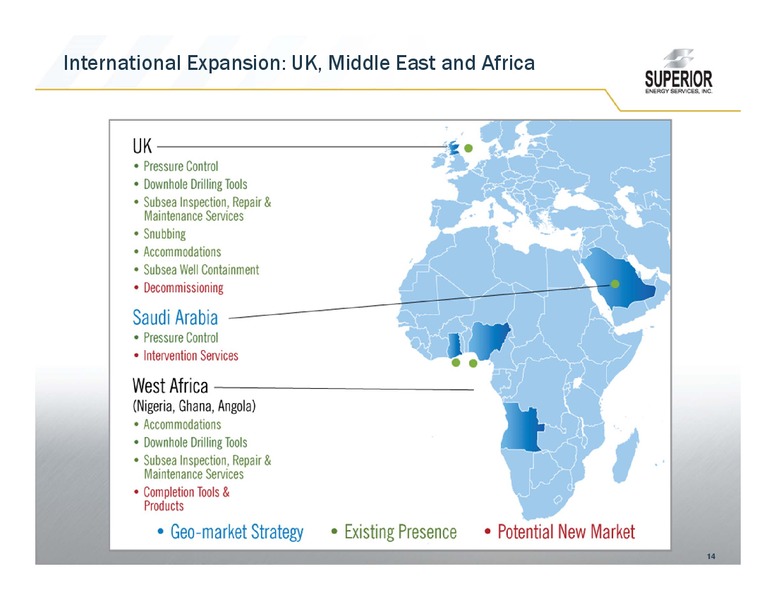
International Expansion: UK, Middle East and Africa 14
International Expansion: Asia Pacific 15
Capital Allocation Capital Expenditures 2013 Capital Expenditures by Segment Subsea and Drilling 2013: 600 million to 700 million Technical Products and Solutions Services Growth capex for GOM and international; 25% 40% primarily…
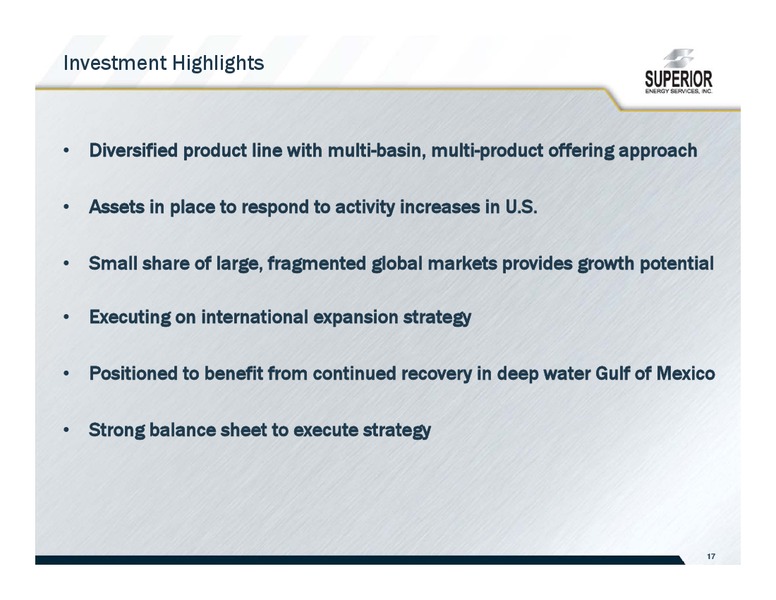
Investment Highlights Diversified product line with multi-basin, multi-product offering approach Assets in place to respond to activity increases in U.S. Small share of large, fragmented global markets provides growth potential…
EBITDA Reconciliation Earnings before interest, taxes depreciation, amortization and loss on early extinguishment of debt (EBITDA) is a non-GAAP financial measurement. We use EBITDA because we believe that such a measurement is a widely…
 Loading...