U.S. Silica BB&T Capital Markets 7th Annual Commercial & Industrial Conference March 20, 2013
U.S. Silica is Attractively Positioned Company Profile Commercial Silica Market Share Leading industrial minerals supplier Other Over 250 products and 1,800 customers Oil & Gas Proppants: Frac sand Industrial & Specialty: Glass,…
SLCA: A Diversified Option to Play NA Shale Growth Rapid Demand Early Innings of Proppant demand growth rig Growth Shale Revolution count growth Low Cost Difficult to Find, Permit Long lead times, frequent capacity Supply is and…
Frac Sand Demand Outstrips Drilling Activity Horizontal Wells Lateral Stages per Proppant Proppant Demand Rig Count per Rig Length Lateral per Stage Growth Drivers Proppant growth has recently outpaced rig count growth due to…
Oil & Gas: 2012 Performance FINANCIAL PERFORMANCE KEY ACCOMPLISHMENTS 2012 2011 Growth Developed Greenfield mine Sales 243.8 107.1 128% and processing plant in Sparta, WI Contribution 140.1 67.6 107% Expanded strategic customer…
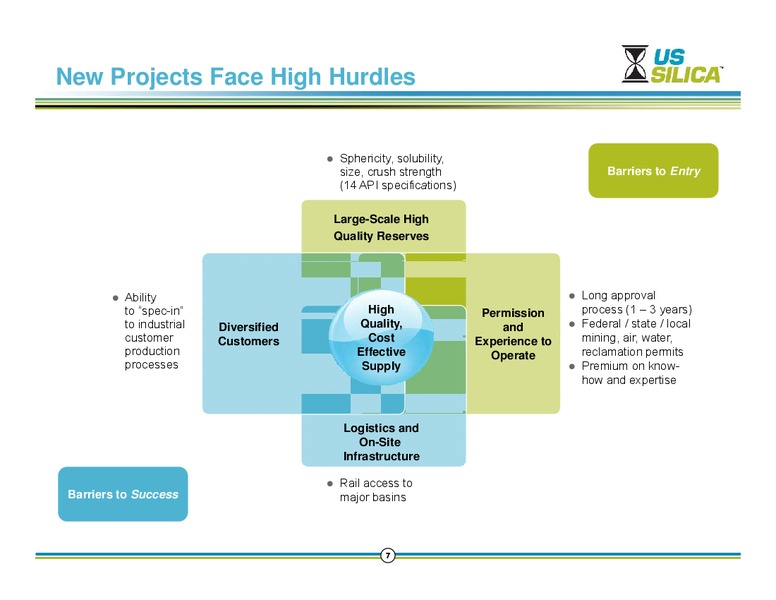
New Projects Face High Hurdles Sphericity, solubility, size, crush strength Barriers to Entry (14 API specifications) Large-Scale High Quality Reserves Ability Long approval to spec-in High Permission process (1 3 years) to…
Unique Industrial & Specialty Position Drivers of Stability Segment Applications U.S. Silicas multiple plants provide supply l redundancy d d andd llow Smartphones, tablets, Glass containers, automotive transportation costs…
Transforming the ISP Segment Invest in Talent Enhance R&D Implement New Technology New VP/GM New Technical Director Specialty deposits Market Development p team Product Development capability Enhanced processing Technical Sales…
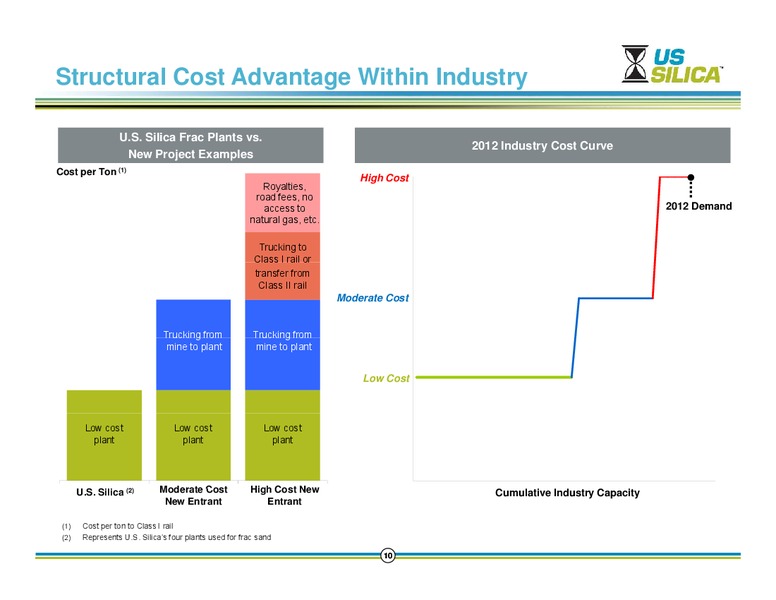
Structural Cost Advantage Within Industry U.S. Silica Frac Plants vs. 2012 Industry Cost Curve New Project Examples Cost per Ton (1) High Cost Royalties, Royalties road fees, no access to 2012 Demand natural gas, etc. Trucking…
Differentiated Footprint and Transportation Network Transportation Assets Railroad R il d access on BNSF BNSF, Union Pacific, CN, CP and CSX Barge access 15 in in-basin basin transloads transloads, many of which can be…
A Multi-Plant Network is Required for National Coverage Class I Rail Serving U.S. Silica Plants E t Bakken East B kk Most WI West Bakken startups are on the CN network E l F Eagle Ford d or Class II rail ed Directly…
U.S. Silicas Highly Efficient Logistic Solutions Plant Unit Train Transload Well Head What is a Unit Train What is a Transload Consists of 70-100 cars (8k -11k tons) that are shipped Rail terminal located in the basin direct from…
Long-Standing Customer Relationships U.S. Silica Benefits How We Work With Customers Customer Benefits Competitive advantage over new Provide large scale scale, multi-plant access Flexibility to cost efficiently move entrants on…
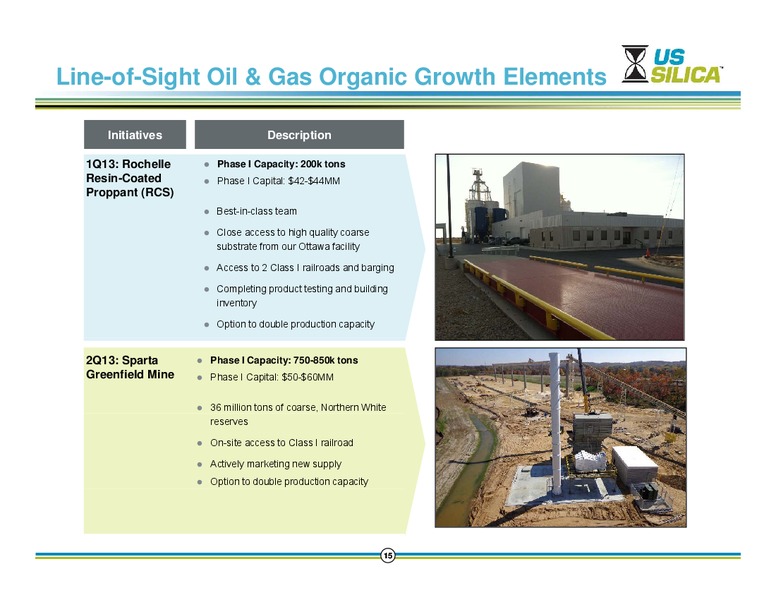
Line-of-Sight Oil & Gas Organic Growth Elements Initiatives Description 1Q13: Rochelle Phase I Capacity: 200k tons Resin-Coated Phase I Capital: 42-44MM Proppant (RCS) Best-in-class team Close access to high quality coarse…
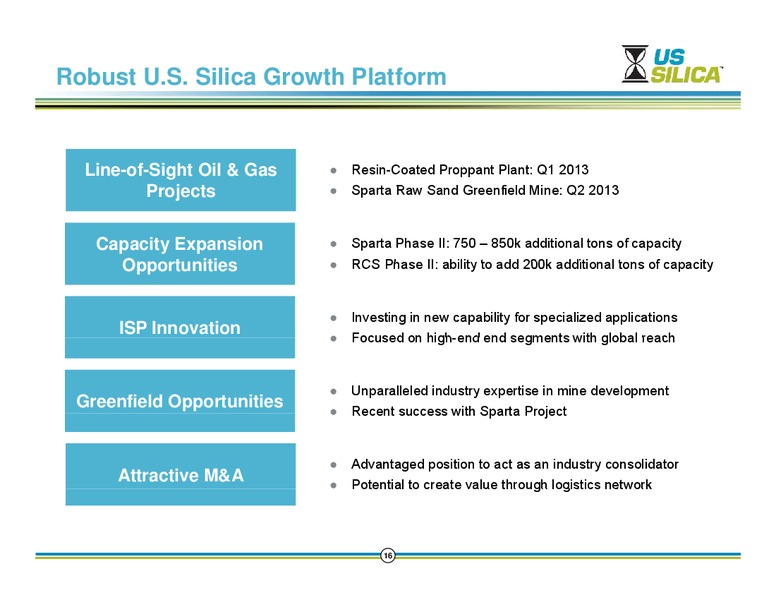
Robust U.S. Silica Growth Platform Line-of-Sight Oil & Gas Resin-Coated Proppant Plant: Q1 2013 P j t Projects S t Raw Sparta R S Sand dGGreenfield fi ld Mi Mine: Q2 2013 Capacity Expansion Sparta Phase II: 750 850k…
Strong Balance Sheet to Fund Growth Initiatives Summary Capitalization (US in thousands) 32.1MM capacity under 12/31/2012 12/31/2011 g asset-based revolving Cash and Cash Equivalents 61,022 59,199 line-of-credit Asset-Based…
Historical Financial Summary Volume Revenue (MM Tons) (MM) Adjusted EBITDA (1) Capital Expenditures (MM) (MM) (1) See Appendix A for GAAP reconciliation 18
Compelling Investment Opportunity 2x Revenue and 3x Adj. EBITDA over last 3 years P Proven R Results lt Di Diverse customer t relationships l ti hi Strong operating cash flows E Economically i ll iirreplaceable l bl…
Appendix A 20
Reconciliation (Adjusted EBITDA to Net Income) Reconciliation of Adjusted EBITDA US in thousands 12/31/12 12/31/11 Net Income 79,154 30,253 Total Interest Expense, Net of Interest Income 13,615 18,347 Provisions of Taxes 30,651…
Reconciliation (Adjusted EBITDA to Net Income) (1) Includes non-cash deductions, losses and charges arising from adjustments to estimates of a future litigation liability and the decision by our hourly workforce at our Rockwood…
 Loading...