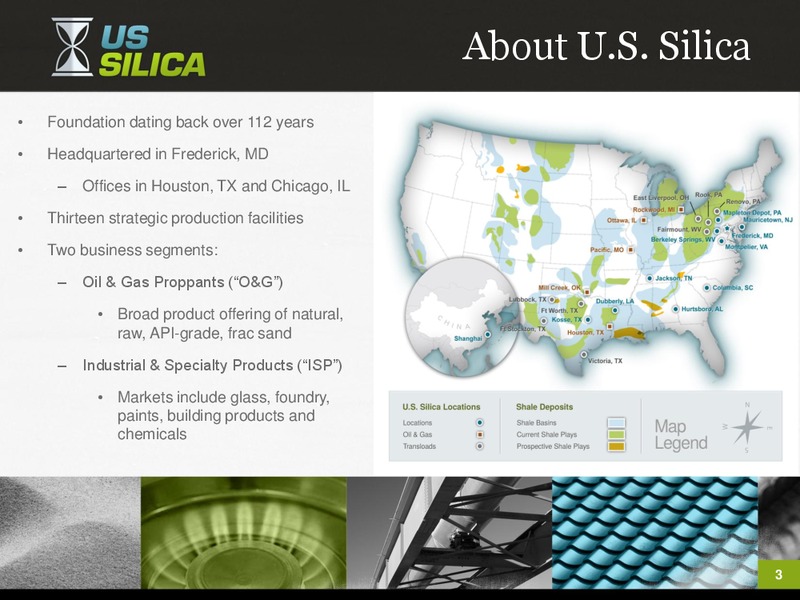
About U.S. Silica Foundation dating back over 112 years Headquartered in Frederick, MD Offices in Houston, TX and Chicago, IL Thirteen strategic production facilities Two business segments: Oil & Gas Proppants (O&G) Broad…
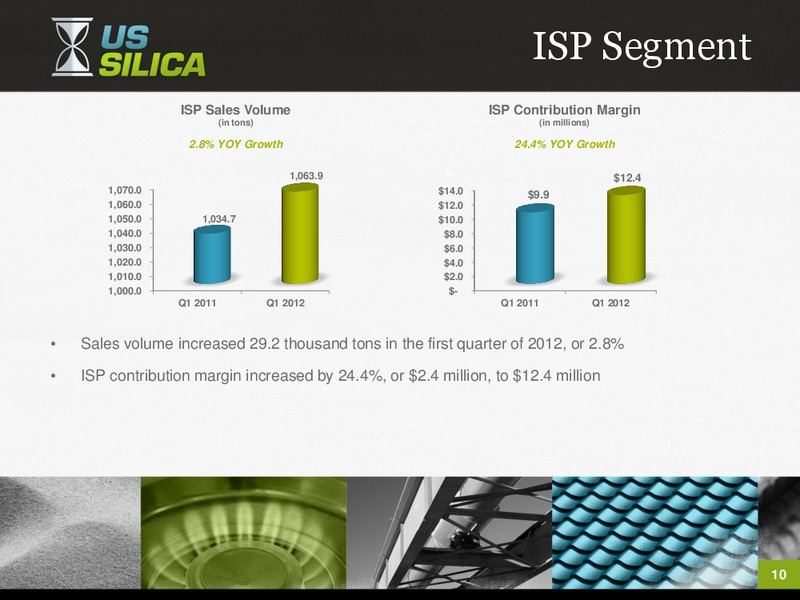
Market Update Oil & Gas Proppants Industrial & Specialty Products Natural gas prices drive redeployment of Experiencing growth and increased demand production rigs from dry gas basins to wet gas and oil basins Volume increase of…
Capital Projects Resin Coated Sand Plant Rochelle, IL Construction began during the first quarter of 2012 Expected to be operational by the first quarter of 2013 Initial production capacity of 200,000 tons or 400 million pounds…
Capital Projects Greenfield Production Facility Sparta, WI Acquired the land and over 38 million tons of estimated reserves in December 2011 Received all necessary permitting to begin construction in January 2012 Board of Directors…
First Quarter 2012 Financial Results (unaudited; in millions except statistics and per share) Three Months Ended March 31, 2012 2011 Key Operating Statistics: Tons Sold: (000s) Oil & Gas 679.0 433.8 Industrial & Specialty Products…
Cash Flow and Liquidity Net cash provided by operations was 1.5 million in the first quarter of 2012, compared to use of 2.8 million for the first quarter of 2011 Improvement in operating income of 19.4 million, offset by 8.0…
2012 First Half and Full Year Guidance We currently estimate for the first half of 2012: Revenue 192 204 million Adjusted EBITDA 72 75 million We currently estimate for full year 2012 : Revenue 395 420 million Adjusted…
Reconciliation (Adjusted EBITDA to Net Income) Three Months Ended March 31, 2012 2011 Net income 19,113 3,510 Total interest expense, net of interest income 3,763 5,441 Provision for taxes (benefit) 7,032 1,647 Total depreciation,…
 Loading...