14th International Gas and Electricity Summit What is the future for gas Sam Laidlaw, CEO, Centrica 21 October 2009
Recent experience From Boom to Bust Growing demand Falling demand Higher prices Excess supply Strong levels of investment Lower spot prices Pullback in investment 2
What a difference 50 years makes British Gas Canvey Island LNG British Gas Isle of Grain LNG Terminal January 1959: Terminal November 2008: A World First: Methane Pioneer A British First: Al Khuwair 5,000 m3 216,000 m3 3
Globalisation of gas in the last 40 years Global Gas Demand Global Gas Supply1 350 bcf per day 350 bcf per day 300 300 Africa S. & C. America S. & C. America Africa 250 Middle East 250 Middle East Russia 200 200 Asia…
Some signs of convergence but regional factors still influence price Gas prices around the Globe (monthly) Gas prices around the Globe - monthly 120 p/th Forward / forecast 100 80 Japan LNG NBP 60 GAIP HH 40 20 0 Oct 05…
The future of gas is uncertain inflexion point Scenario 1 Do Nothing Scenario 2 Partnership Gas seen as unreliable Gas key part of the solution to climate change Renewed calls for energy Switching from coal to gas generation…
Scenario 1: Major fall in gas consumption in 2009, if unaddressed will take years to recover European Gas Consumption 30,000 bcf / yr Potential at 2008 rate Latest forecast 20,000 10,000 2001 2005 2010 2015 7 Source:…
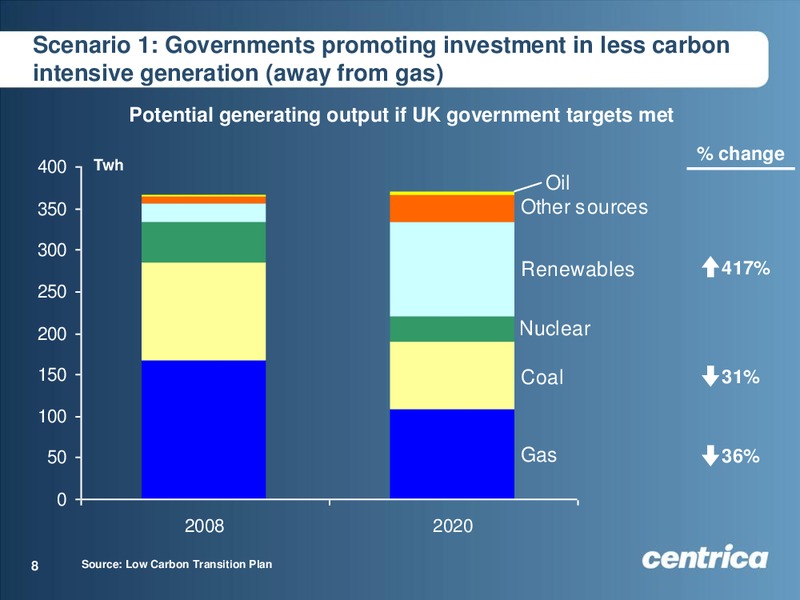
Scenario 1: Governments promoting investment in less carbon intensive generation (away from gas) Potential generating output if UK government targets met % change 400 Twh Oil 350 Other sources 300 Renewables 417% 250 200 Nuclear…
Scenario 1: Energy independence means investment in local sources, above foreign imported gas (1 of 2) 70 bcf per day Growth rate in annual 5% production 4% 60 3% 50 2% 40 1% 30 0% -1% 20 -2% 10 -3% 0 -4% 2000 2001 2002…
Scenario 1: Energy independence means investment in local sources, above foreign imported gas (2 of 2) US Gas Supply Reserves Unconventional Gas Reserves1 300 tcf 2,500 tcf 2,070 207 211 2,000 200 164 1,500 (21)% 29% 8x 1,000…
Scenario 1: These factors, plus increased capacity, has led to an LNG supply overhang Global LNG Capacity Utilisation 95 % Forward / forecast 90 85 80 75 2005 2006 2007 2008 2009 2010 2011 2012 11 Source: CERA
Scenario 2: Technology can power an increase in gas and lower CO2 emissions Distributed Generation - Heat and Power Stirling Engine Solid Oxide Fuel Cells 12
Scenario 2: Replacing coal generation with gas could deliver US CO2 reduction target 7 US CO2 emissions 6 -1.3bn tonnes of CO2 CO2 emissions (bn tonnes) US 2020 target 5 Coal Coal replaced by gas 4 Gas Gas Oil et al Oil…
Major markets for gas will remain import dependent, developing these markets requires stronger partnership Gas imports amongst the major import markets 4,000 bcf / yr 3,500 Pipeline: Russia 3,000 Pipeline: Norway, 2,500 Netherlands,…
Co-dependency of supply and demand key to develop global LNG infrastructure Divertible Europe UK USA
Conclusion Demand holders and Resource holders have to decide whether gas will be the fuel of the 21st century 16
 Loading...