Second Quarter 2015 Financial highlights July 24, 2015 150 years years BASF increases sales and earnings slightly in the second quarter
150 years BASF increases sales and earnings slightly in the second quarter Business performance Q215 Q214* vs. Q214 Sales 19.1 billion 18.5 billion +3% EBITDA 3.0 billion 2.7 billion +11% EBIT before special items 2.0 billion 2.0…
150 years Important milestones in Q2 2015 Inauguration of first world-scale New chemical catalyst acrylics complex in South America plant in China New agricultural research station Divestment of textile chemicals in India…
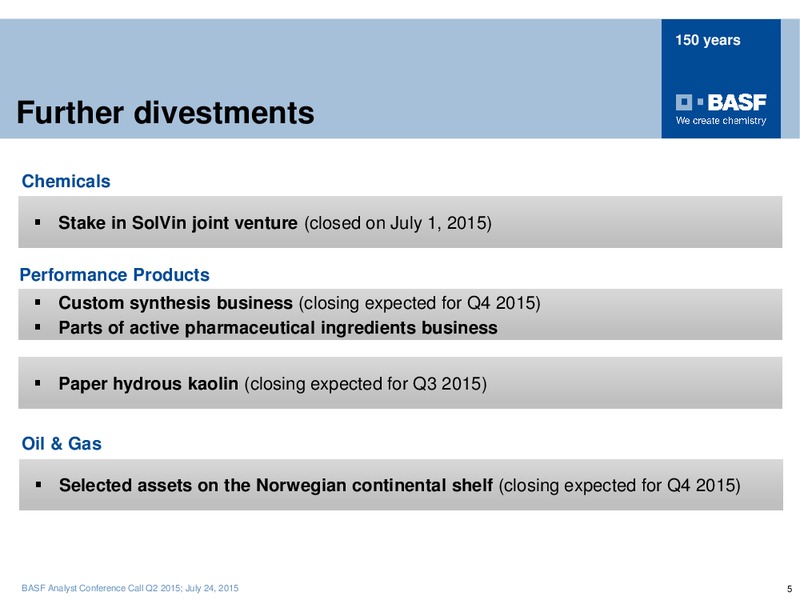
150 years Further divestments Chemicals Stake in SolVin joint venture (closed on July 1, 2015) Performance Products Custom synthesis business (closing expected for Q4 2015) Parts of active pharmaceutical ingredients business…
150 years Chemicals Higher fixed costs from start-ups impact earnings Q215 segment sales (in million ) vs. Q214 EBIT before special items (in million ) Intermediates Petrochemicals 800 726 739 1,660 616 580 570 548 600 +5% (18%)…
150 years Performance Products Earnings impacted by challenging markets Q215 segment sales (in million ) vs. Q214 EBIT before special items (in million ) Performance Dispersions Chemicals & Pigments 600 515 1,066 1,245 435 +6% +4%…
150 years Functional Materials & Solutions Strong business with automotive and construction Q215 segment sales (in million ) vs. Q214 EBIT before special items (in million ) Performance Catalysts 600 Materials 1,700 431 458 1,776…
150 years Agricultural Solutions Half-year results on prior year level Segment sales EBIT before special items (Q215 vs. Q214 / H115 vs. H114; million ) (Q215 vs. Q214 / H115 vs. H114; million ) 0% 4,000 1,000 943 939 3,576 3,319…
150 years Oil & Gas Decrease in earnings driven by lower prices Q215 segment sales (in million ) vs. Q214 EBIT bSI*/Net income* (million ) Natural Gas Exploration & Trading Production 800 2,964 704 600 546 +24% (13%) 431 3,668…
150 years Review of Other Million Q215 Q214 Sales 757 855 EBIT before special items (63) (328) Thereof corporate research costs (102) (97) group corporate costs (64) (57) currency results, hedges and other 151 (117) valuation…
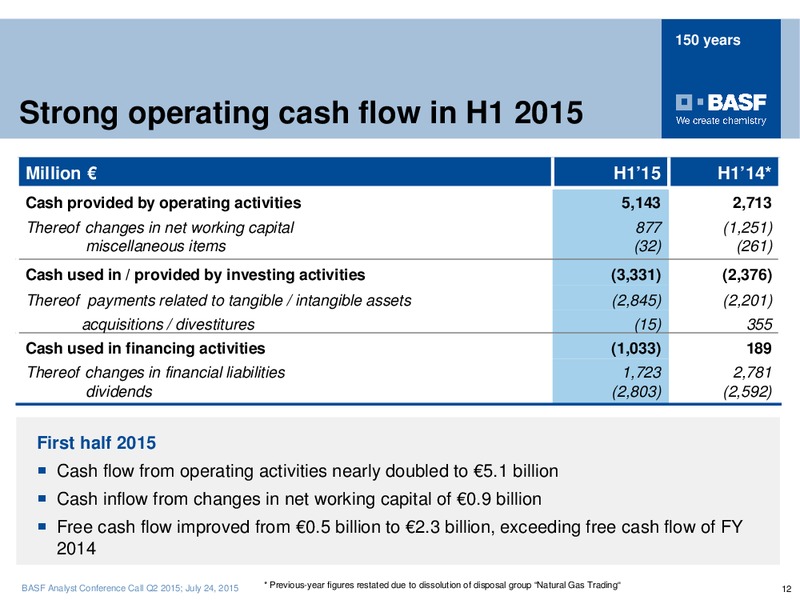
150 years Strong operating cash flow in H1 2015 Million H115 H114* Cash provided by operating activities 5,143 2,713 Thereof changes in net working capital 877 (1,251) miscellaneous items (32) (261) Cash used in / provided by…
150 years Balance sheet remains strong Balance sheet June 30, 2015 vs. December 31, 2014* Highlights June 30, 2015 (in billion ) Total assets increased by 4.3 75.7 75.7 billion due to: 71.4 64.4 71.4 - FX-related effects -…
150 years Outlook 2015 confirmed Outlook 2015 We aim to increase volumes and sales excluding the effects of acquisitions and divestitures. Sales are expected to be slightly higher than in 2014, driven by higher sales in the…
 Loading...