Investor Day Paolo Rocca Chairman and CEO The Solomon R. Guggenheim Museum New York City March 25, 2004
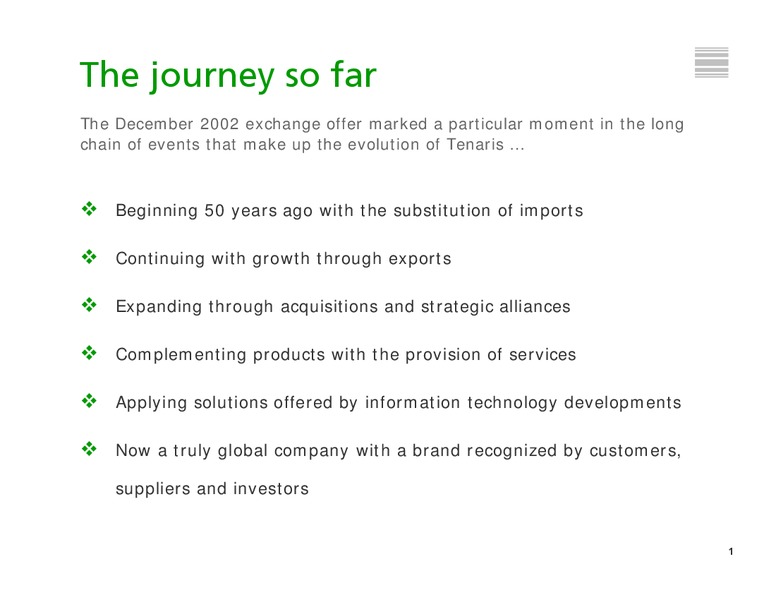
The journey so far The December 2002 exchange offer marked a particular moment in the long chain of events that make up the evolution of Tenaris Beginning 50 years ago with the substitution of imports Continuing with growth through…
Solid industrial base The growth and success of Tenaris has been built around the constant renewal of its production system 3 steel mills with annual capacity of 3.0 million tons 11 rolling mills with annual capacity of 3.5 million…
Profitable operations Million US 2000 2001 2002 2003 Net Sales 2,361 3,174 3,219 3,180 Seamless 1,992 84% 2,497 79% 2,244 70% 2,376 75% Welded 209 9% 433 14% 580 18% 351 11% Energy 59 2% 113 4% 210 7% 333 10% Other 102 4%…
Geographically diversified sales Sales volume Net Sales 2003 Thousands of tons 2002 2003 Far East & Oceania South America Seamless pipes 2,283 2,278 Middle East 10% & Africa 24% 12% South America 324 322 North America 401 608 24%…
Strong financial position Indebtedness (Million US) Firm value US4,404 As of December 31, 2003 Net Debt 448 Cash & Cash Equivalents* 386 Financial Debt** 834 Net Debt 448 Net Debt / Equity 24.3% Market Cap (1) 3,956 Balance…
Global leader in seamless OCTG World apparent consumption of 2003 apparent consumption seamless OCTG - market share by producers Million of tons USA 14% China 14.0 22% 20% 20% 20% 19% 12.0 17% Tenaris 19% 10.0 8.0 Other West…
Supplying the major names in the energy sector 7
Serving global markets with local presence Stavanger z Aberdeenz z Moscow z Calgary AlgomaTubes Rugby zz London z z Mannheim Paris Dalmine z Atyrau z Baku Beijingz NKKTubes z z Houston z Seoul Cairo Tamsa z Dubai Caracas…
The challenge following the 2002 exchange offer ... to start a new cycle of growth and global expansion giving form and substance to the newly integrated company Reorganization completed: Corporate structure and governance Management…
Completion of the exchange offer The December 2002 exchange offer and subsequent delistings aligned the interests of shareholders and integrated Tenaris as a global company Tenaris 55.7% 100.0% 51.6% 100.0% Tamsa 44.3% Siderca…
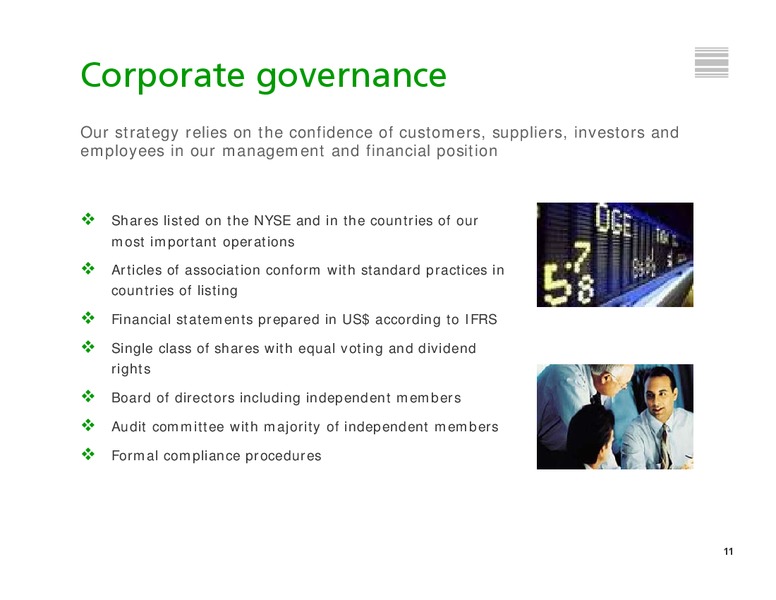
Corporate governance Our strategy relies on the confidence of customers, suppliers, investors and employees in our management and financial position Shares listed on the NYSE and in the countries of our most important operations…
Business units Focused on four principal market segments each with distinct requirements Understanding our customers needs Developing new products and services Identifying opportunities to add value in the supply chain Building brand…
Supply chain management services and technology Product specification, flexible order processing, specialized industrial procurement (Exiros), strict quality control, efficient inventory management and global on-site service…
A year of progress and consolidation Strategic alliances Sandvik - exclusive distribution of high specialty OCTG products Socotherm joint marketing and development of coating solutions Tianjin pipe threading and oilfield accessories…
Creating value for shareholders Increase in the market cap since Tenaris started trading Millions of US 4,000 3,600 US135 million 3,956 of dividend 3,200 (US1.14 per ADS) 2,800 2,400 2,000 US115 million 1,600 1,973 of dividend…
Chinas growth affects raw material costs but also offers opportunities 16
Chinas growth in steel demand Production and consumption of steel and import of iron ore Millions of tons Millions of tons 350 350 320 300 281 300 244 250 250 201 200 226 200 163 202 151 182 150 132 150 151 140 100 124…
Raw material prices increase Historic Evolution... 1/99 = 100% North America 350% Pig Iron: Gulf Coast - USA (CRU) Pig Iron HBI: Gulf Coast (CRU) 300% Scrap: shredded E. Coast USA (CRU) HBI 250% Scrap 200% 150%…
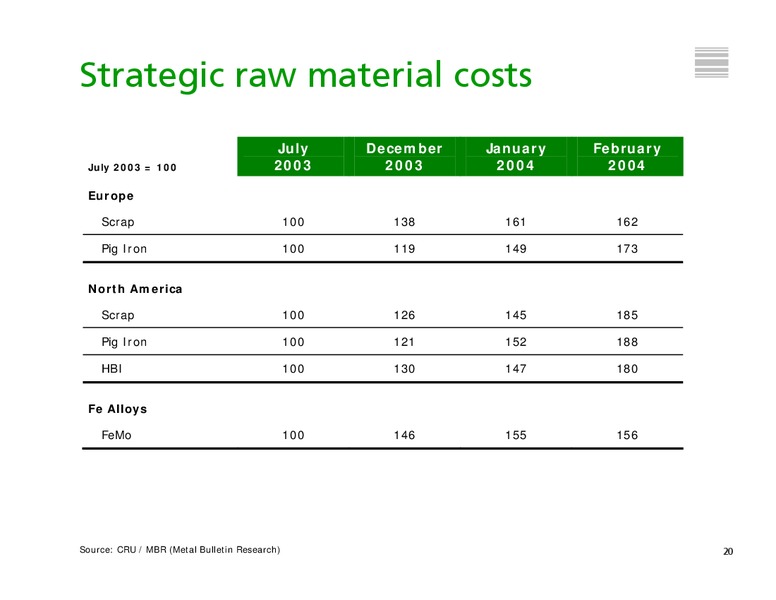
Strategic raw material costs July December January February July 2003 = 100 2003 2003 2004 2004 Europe Scrap 100 138 161 162 Pig Iron 100 119 149 173 North America Scrap 100 126 145 185 Pig Iron 100 121 152 188 HBI 100…
Chinas growth in oil consumption Chinese petroleum production and consumption Mill. barrels per day 6,000 5,000 4,000 3,000 2,000 1,000 0 1980 1982 1984 1986 1988 1990 1992 1994 1996 1998 2000 2002 2004 Production…
 Loading...