Simmons Energy Conference February 28, 2013 Bill Austin Executive Vice President and Chief Financial Officer
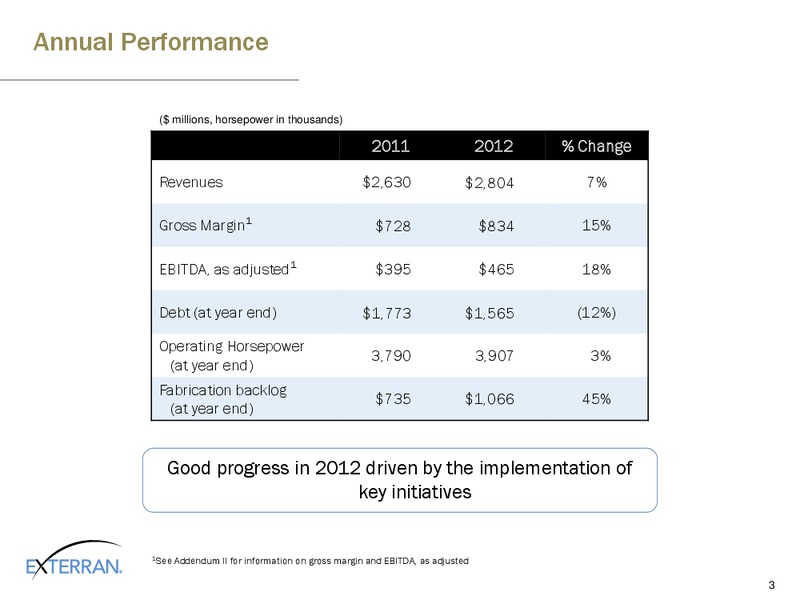
2012 Accomplishments Improved operating profitability by focusing on cost and gross margin improvement Grew working horsepower in both North America and International contract operations Increased fabrication revenues, profit and…
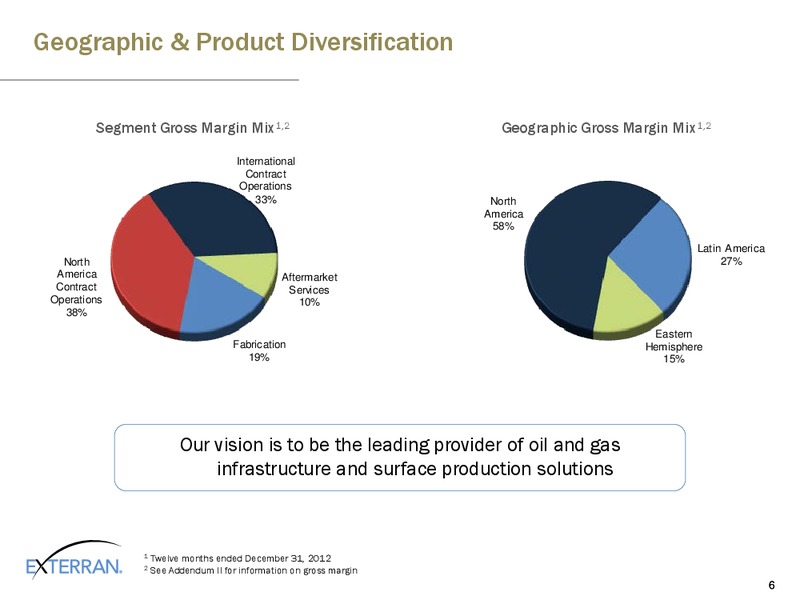
Geographic & Product Diversification Segment Gross Margin Mix1,2 Geographic Gross Margin Mix1,2 International Contract Operations 33% North America 58% Latin America North 27% America Aftermarket Contract Services…
U.S. Shale Plays We expect that the North America markets will continue to have strong demand for all of our products and services Source: Energy Information Administration 8
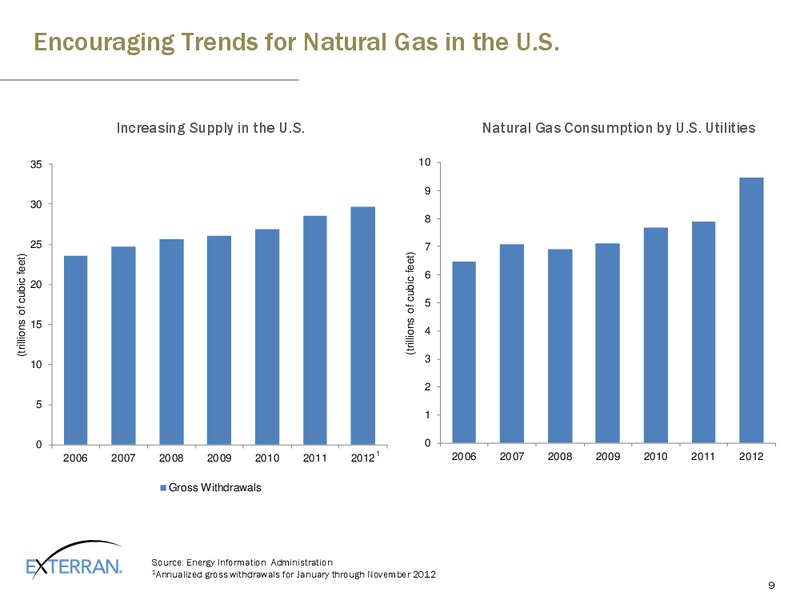
Encouraging Trends for Natural Gas in the U.S. Increasing Supply in the U.S. Natural Gas Consumption by U.S. Utilities 35 10 9 30 8 25 7 (trillions of cubic feet) (trillions of cubic feet) 6 20 5 15 4 3 10…
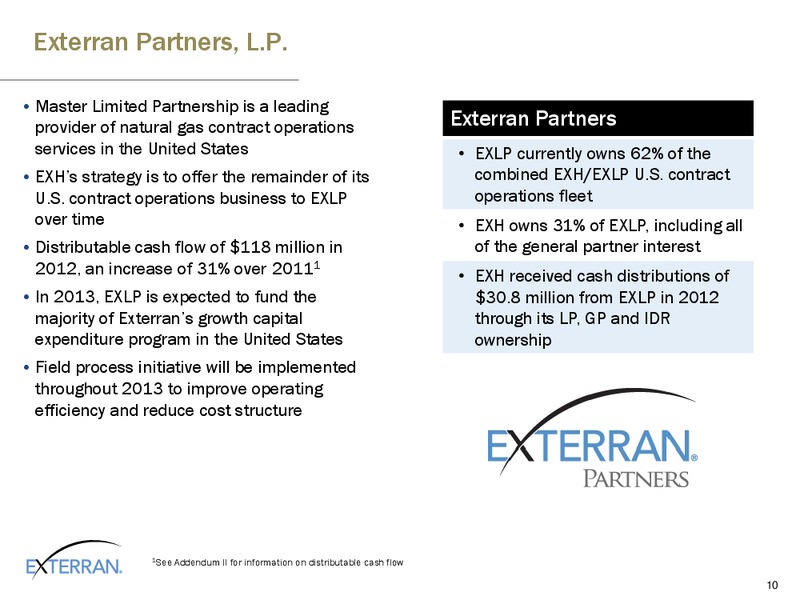
Exterran Partners, L.P. Master Limited Partnership is a leading provider of natural gas contract operations Exterran Partners services in the United States EXLP currently owns 62% of the EXHs strategy is to offer the remainder of…
Oil & Gas Drilling and Production Spending Global Capital Spending Increasing 500 450 400 350 300 ( billions) 250 200 150 100 50 0 2007 2008 2009 2010 2011 2012 2013 2014 2015 2016 2017 U.S. International…
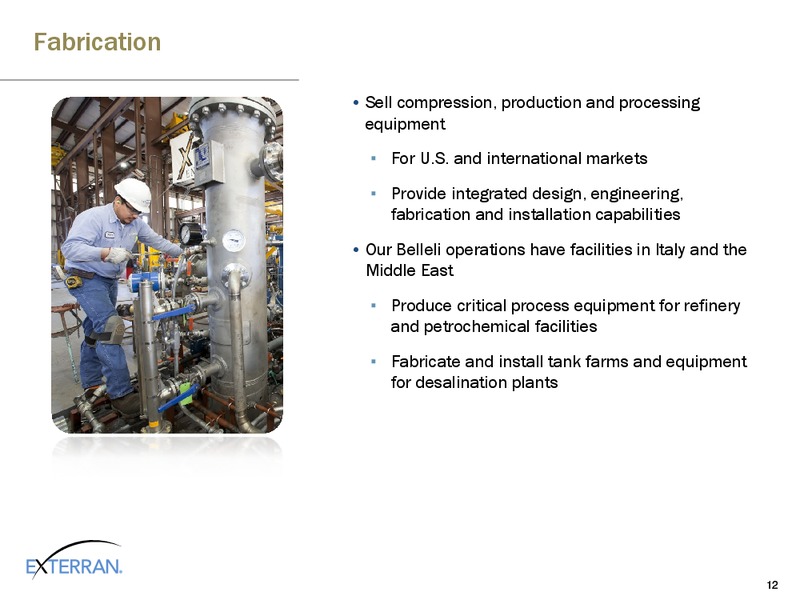
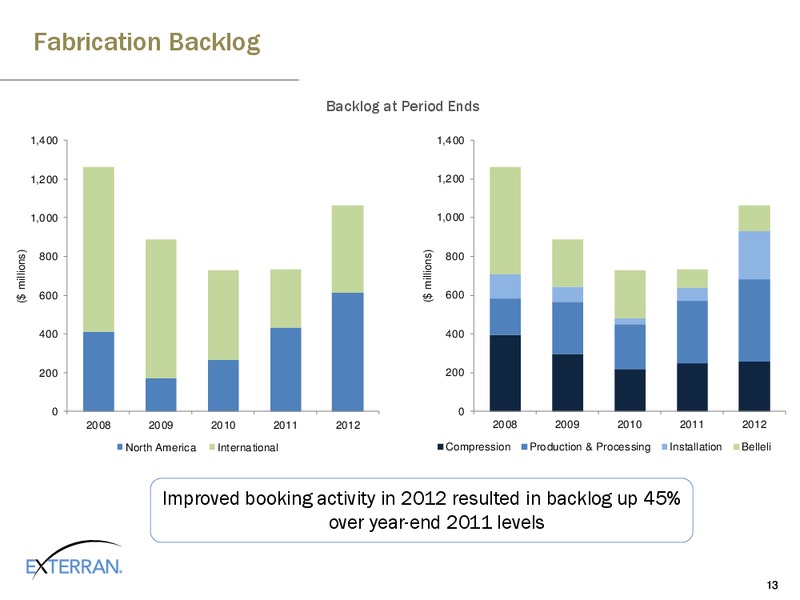
Fabrication Sell compression, production and processing equipment For U.S. and international markets Provide integrated design, engineering, fabrication and installation capabilities Our Belleli operations have facilities in Italy…
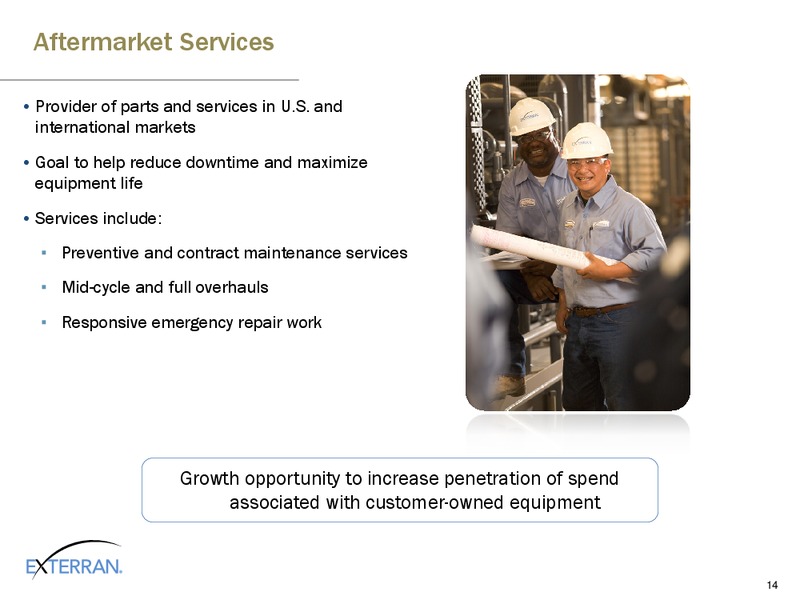
Aftermarket Services Provider of parts and services in U.S. and international markets Goal to help reduce downtime and maximize equipment life Services include: Preventive and contract maintenance services Mid-cycle and full…
Performance Initiatives Labor, lube oil, shop supply initiatives North America Contract Operations Price increases in 2012 and 2013 Lube oil and purchasing initiatives International Contract Operations Contract extensions with…
Growth Activities Investing in new North America contract operations fleet units to modernize and position our fleet for growth Larger units for gathering applications and smaller units for gas lift applications Healthy backlog of…
Growth Strategy Priorities Goals Focus on our core businesses Bring value-added and leverage our global solutions to our customers leadership position in Deliver improved returns to compression to drive growth our stockholders…
Investment Merits Improved operating and financial performance in 2012 Enhanced financial flexibility to meet growth opportunities Substantial opportunities for our products and services in our global markets Continued focus on…
Appendix Slides
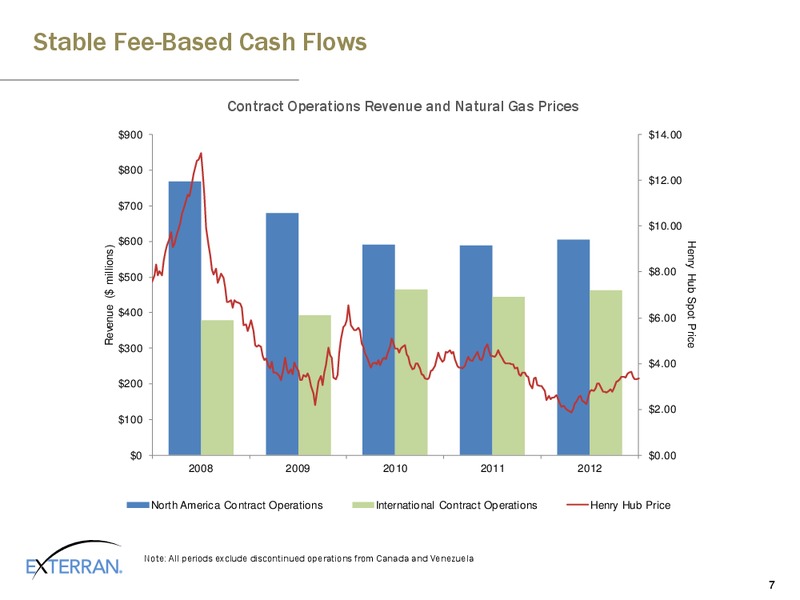
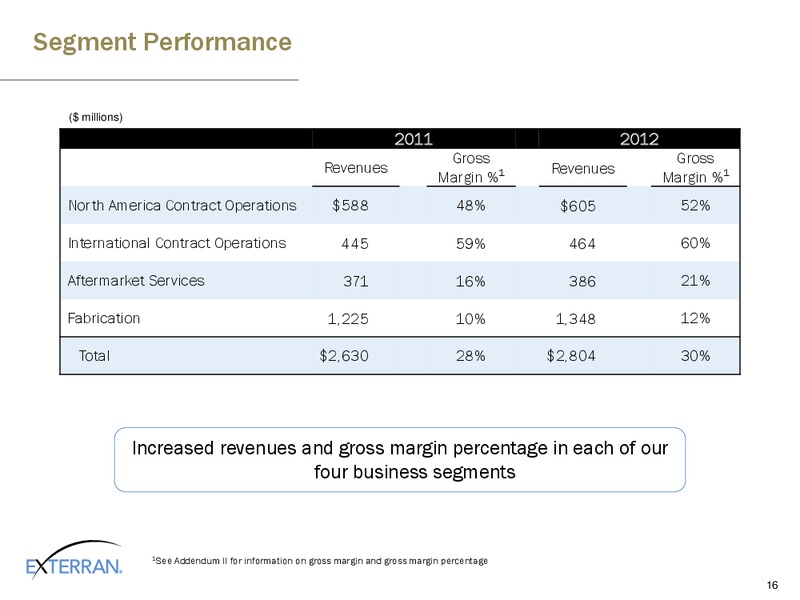
Exterran - Financial Results Summary1,2 ( in millions) 2008 2009 2010 2011 2012 Revenues North America Contract Operations 767.9 679.0 592.1 588.0 605.4 International Contract Operations 379.8 392.0 465.1 445.1 464.0 Aftermarket…
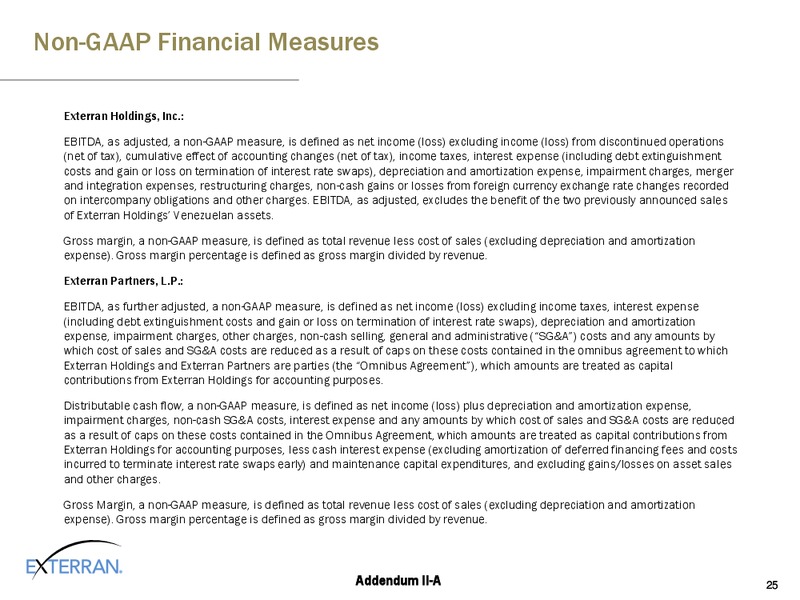
Non-GAAP Financial Measures Exterran Holdings, Inc.: EBITDA, as adjusted, a non-GAAP measure, is defined as net income (loss) excluding income (loss) from discontinued operations (net of tax), cumulative effect of accounting changes…
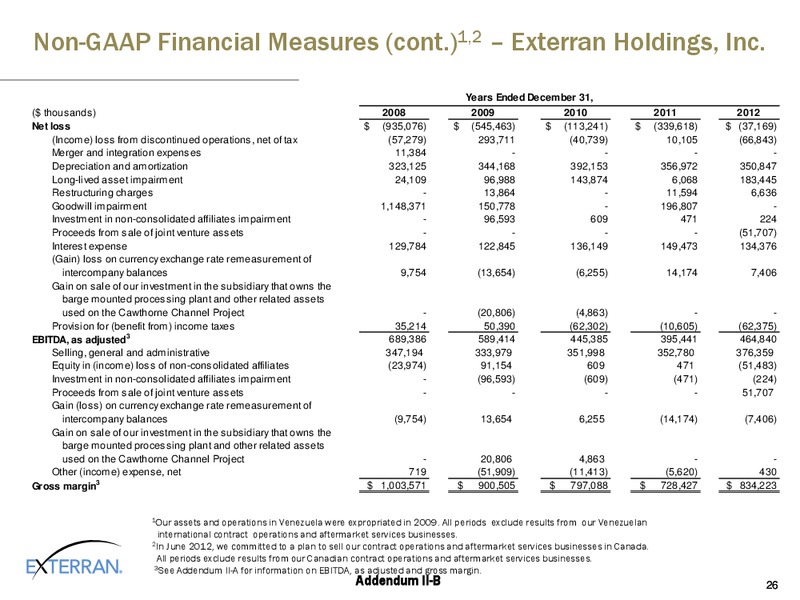
Non-GAAP Financial Measures (cont.)1,2 Exterran Holdings, Inc. Years Ended December 31, ( thousands) 2008 2009 2010 2011 2012 Net loss (935,076) (545,463) (113,241) (339,618) (37,169) (Income) loss from discontinued operations, net of…
Non-GAAP Financial Measures (cont.) Exterran Partners, L.P. Years Ended December 31, ( in thousands) 2011 2012 Net income 6,053 10,509 Depreciation and amortization 67,930 88,298 Long-lived asset impairment 1,060 29,560 Selling,…
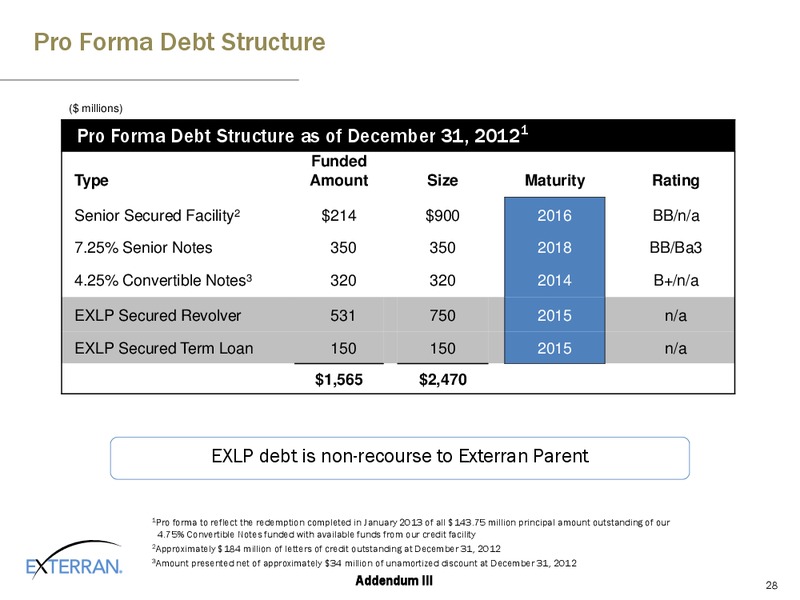
Pro Forma Debt Structure ( millions) Pro Forma Debt Structure as of December 31, 20121 Funded Type Amount Size Maturity Rating Senior Secured Facility2 214 900 2016 BB/n/a 3 7.25% Senior Notes 350 350 2018 BB/Ba3 4.25%…
 Loading...