July 26, 2011 Deep Cygnus performing trenching and cable burial operations at the Greater Gabbard Offshore Wind Farm in the North Sea Second Quarter 2011 Conference Call
Presentation Outline Executive Summary Summaryy of Q2 2011 Results (pg (pg. 4)) Operational Highlights by Segment Contracting Services (pg. 9) Oil & Gas (pg. 16) Key Balance Sheet Metrics (pg. 19) 2011 Outlook (pg. (pg 21)…
Executive Summary 4
Executive Summary ( iin millions, illi exceptt per share h data) d t ) Quarter Ended Six Months Ended 6/30/2011 6/30/2010 3/31/2011 6/30/2011 6/30/2010 Revenues 338 299 292 630 501 Gross Profit: 131 66 77 208 103 Operating 39%…
Executive Summary Q2 2011 EPS of 0.39 per diluted share driven by strong results from oil and gas business, robust well intervention and production facilities businesses, and recovery in robotics business Balance sheet continues to…
Executive Summary Oil and Gas o Second quarter average production rate of 139 Mmcfe/d (68% oil) o Production through July 24 averaged approximately 114 Mmcfe/d (70% oil) July production impacted by scheduled downtime of third party…
Operational Highlights 8
Contracting Services ( in millions, except percentages) 89% utilization in Well Ops Quarter Ended Weak GOM market continues to impact June 30 March 31 Subsea Construction 2011 2010 2011 Revenues (A) Caesar in shipyard undergoing…
Equity in Earnings of Equity Investments ( in millions) Quarter Ended June 30 March 31 2011 2010 2011 Independence Hub 4 5 4 Deepwater Gateway (Marco Polo) 1 1 1 CloughHelix JV 1 (4) - Equity in Earnings 6 2 5 10
Contracting Services Well Ops GOM Q4000 worked for Shell on multiple projects throughout the second quarter 93% utilization in the second quarter Strong outlook anticipated for rest of 2011 and backlog building for 2012 North Sea…
Contracting Services Robotics Strong robotics utilization in Europe and West Africa UK projects utilizing the I-Trencher and T-750 extended into Q4 ROVDrill upgrades completed and scheduled for deployment to the UK in late Q3…
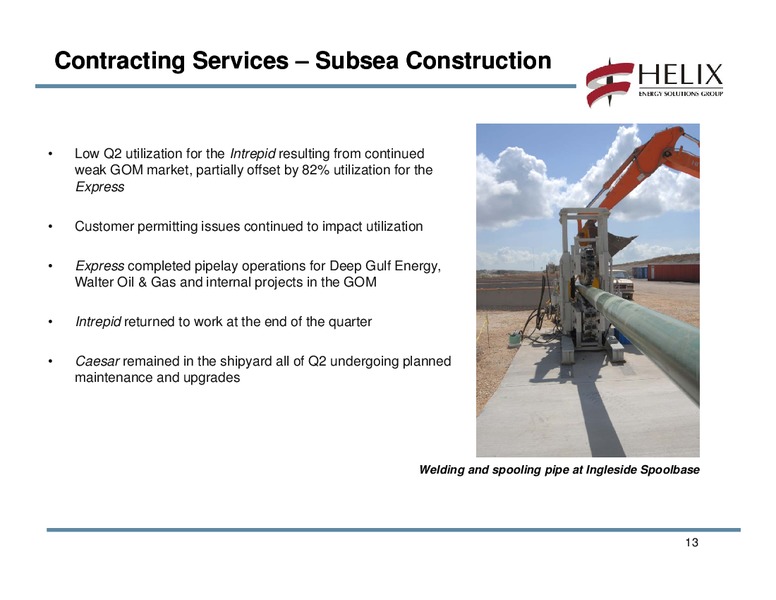
Contracting Services Subsea Construction Low Q2 utilization for the Intrepid resulting from continued weak GOM market, partially offset by 82% utilization for the Express Customer permitting issues continued to impact…
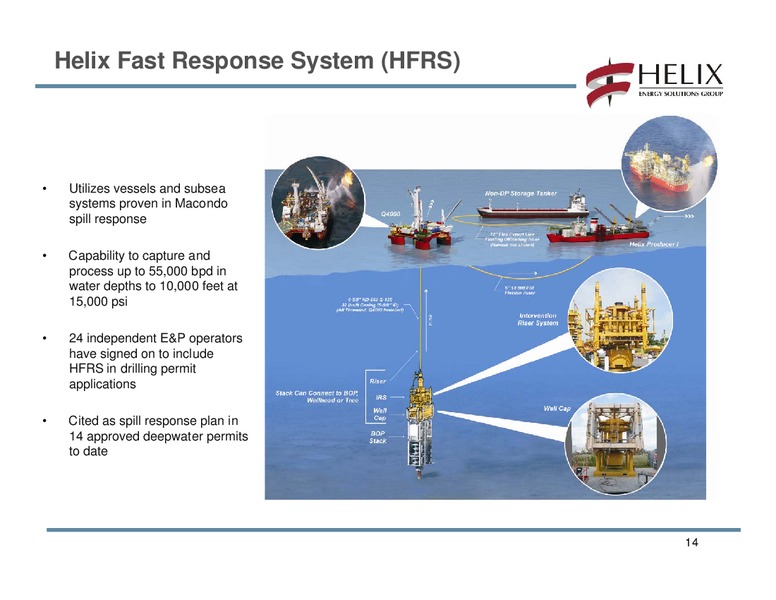
Helix Fast Response System (HFRS) Utilizes vessels and subsea systems proven in Macondo spill response p y to capture Capability p and process up to 55,000 bpd in water depths to 10,000 feet at 15,000 psi 24 independent…
Oil & Gas Financial Highlights ( in millions, except production and price data) Quarter Ended June 30 March 31 2011 2010 2011 (A) Second quarter 2011 impairments primarily associated Revenue 172 103 169 with six of our Gulf of Mexico…
Oil & Gas Operating Costs ( in millions millions, except e cept per Mcfe data) Quarter Ended June 30 March 31 2011 2010 2011 Total per Mcfe Total per Mcfe Total per Mcfe DD&A (A) 52 4.13 67 5.67 69 4.82 Operating and Other:…
Summary of Jul 2011 Dec 2012 Hedging Positions * Total Volume Pricing Swap Average Collar Price Oil (Bbls) Collars Swaps Hedged Basis Pricing Floor Ceiling 2011 320,000 1,055,000 1,375,000 WTI 82.49 95.00 124.70 2011 150,000 -…
2011 Outlook 2011 Forecast 2011 Forecast Broad Metrics 2010 Actual (revised) (original) Oil and Gas 50 Bcfe 49 Bcfe 47 Bcfe Production EBITDAX 575+ million 475 million 430 million CAPEX 275 million 225 million 179 million…
2011 Outlook Contracting Services o Strong backlog for the Q4000, Well Enhancer and Seawell in 2011 o Continued robotics utilization recovery in second half of 2011, driven primarily by activity outside the GOM o Backlog for Express…
2011 Outlook Capital Expenditures o Contracting Services (110 million) No major vessel projects planned for 2011 Caesar thruster upgrade continues through Q3 Incremental investment in robotics business o Oil and dGGas (165…
Non-GAAP Reconciliations 25
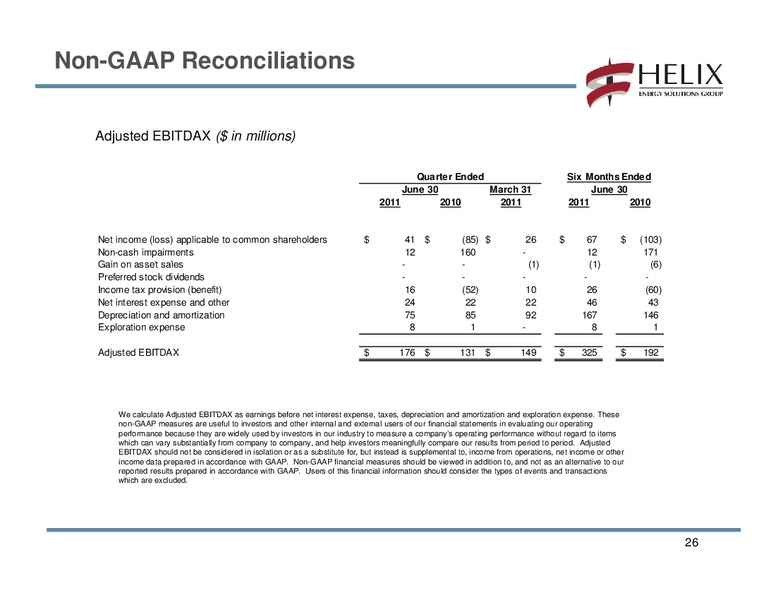
Non-GAAP Reconciliations Adjusted EBITDAX ( in millions) Quarter Ended Six Months Ended J June 30 M March h 31 J June 30 2011 2010 2011 2011 2010 Net income (loss) applicable to common shareholders 41 (85) 26 67 (103)…
Non-GAAP Reconciliations Revenue and Gross Profit As Reported ( in millions) Quarter Ended June 30 March 31 2011 2010 2011 Revenues Contracting Services 171 202 131 Production Facilities 21 21 16 Intercompany elim. - Contracting…
 Loading...