Quarterly Performance 1Q11: beginning of the recovery of operational indicators and increase in capacity utilization (especially anchoring ropes and valves) Gross Profit +24% and EBITDA +197% Energy Products: anchoring ropes and…
Backlog R m Backlog Trend 2,581 2,610 2,384 2,535 1,958 2,289 2,309 2,256 808 770 77 360 693 448 427 247 272 354 Dec-09 Jun-10 Oct -10 Dec -10 May-10 Mar-11 1 year Over 1 year Backlog Mar/2011 (R…
Liquidity R144 million: financing lines as PROGREDIR Strengthening of cash position in coming periods: growing occupation of installed capacity reduction in costs and expenses structure divestment of noncore assets: between R150…
Board of Directors New Board: 7 members, 3 independent 4 new members: Carlos Bellot: COO of OSX Peter Dvorsak: BNDES Luis Carlos Afonso: President of PETROS Wilson Santarosa: Chairman of the Board of PETROS Name Position Nestor…
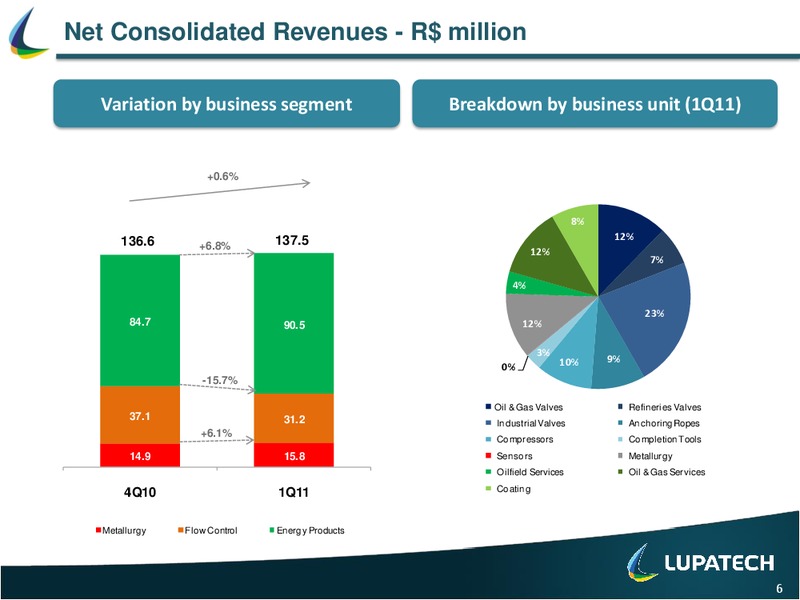
Net Consolidated Revenues - R million Variation by business segment Breakdown by business unit (1Q11) +0.6% 8% 137.5 12% 136.6 +6.8% 12% 7% 4% 23% 84.7 90.5 12% 3% 10% 9% 0% -15.7% Oil & Gas Valves Refineries…
Working Capital and Operational Cash Flow - R million Working Capital x Net Revenues Operational Cash Flow x EBITDA - LTM 1.3x 1.9x 2.4x 3.4x 2.2x 1.6x 188.0 60.4% 1000 56.5% 54.8% 55.5% 61,0% 54.7% 53.9% 900 130.0 131.9…
Capital and Debt Structure Capital Structure Debt Structure (1Q11) 1,149 1,019 165 179 16 15 10 150 150 Equity Debt 13% 87% 17 446 129 Perpetual 2012 2013 2014 2015 2016 2017 2018 Short Term Cash…
IR Contacts Alexandre Monteiro Cynthia Burin CFO & IRO IR Manager irlupatech.com.br www.lupatech.com.br/ir Telephone: +55 (11) 2134-7000 Follow Lupatech on www.twitter.com/LUPA3 (Portuguese) www.twitter.com/LupatechSA…
 Loading...