SBM OFFSHORE N.V. ANALYST PRESENTATION 2 March 2012 Bruno Chabas (CEO) and Mark Miles (CFO) FULL-YEAR 2011 RESULTS page 1
Content 2011 Review 2011 Financials Outlook page 3
2011 Review 2011 Financials Outlook page 4
Key Figures Full year 2011 (In millions of US) Turnover New orders FY 2010 FY 2011 page 5
Summary of 2011 Legacy projects update Legacy: non-core, non-FPSO, untypical of SBM Offshore Yme: constructive engagement with client Deep Panuke: pathway to first gas in summer 2012 Strategy and organisation Management…
Talisman YME update Current status Factors impacting project: delay due to poor productivity and increase in work scope offshore Commercial and reputational imperative to resolve difficulties Arbitration proceedings still ongoing…
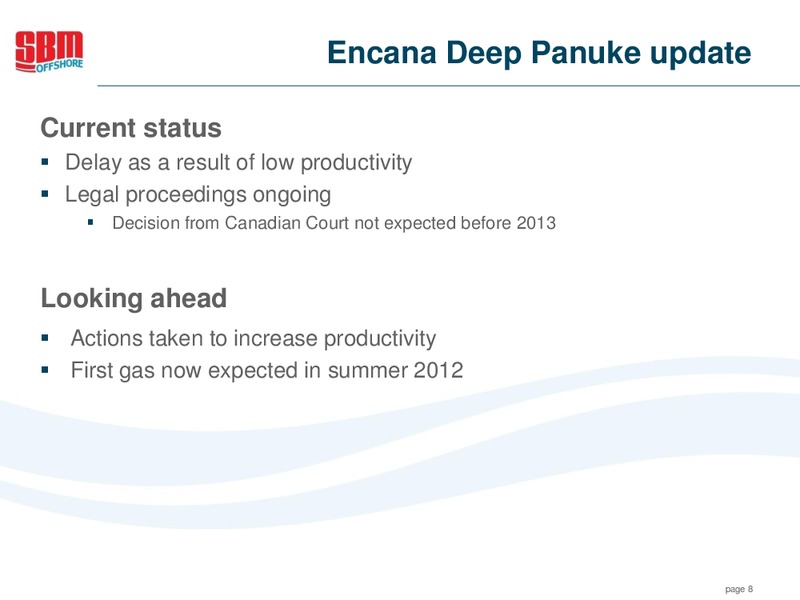
Encana Deep Panuke update Current status Delay as a result of low productivity Legal proceedings ongoing Decision from Canadian Court not expected before 2013 Looking ahead Actions taken to increase productivity First gas now…
Organisation Refocus of organisational structure Rising project size and complexity demands new management structure Key issues: responsibility, accountability, conflict resolution Seven execution centres run by MDs, each with full…
FPSO, FPSO, FPSO SBM focuses growth on core products with historically solid margins page 10
Focus Focus on core competence FPSO is a business with historically solid margins Strong growth profile underpinned by market outlook Technological leadership Unrivalled experience in operations & maintenance of FPSOs over 200…
Major Projects in Execution 2006 2007 2008 2009 2010 2011 2012 2013 2014 2015 MOPU Yme MOPU Deep Panuke FPSO Okha FPSO Aseng FPSO Cidade de Anchieta FPSO Cidade de Paraty FPSO OSX2 FPSO Xikomba Turret FLNG Turret Quad 204 FPSO Cidade…
Remaining Duration of Lease Contracts Firm order portfolio on long term contracts with robust clients page 13
2011 Review 2011 Financials Outlook page 14
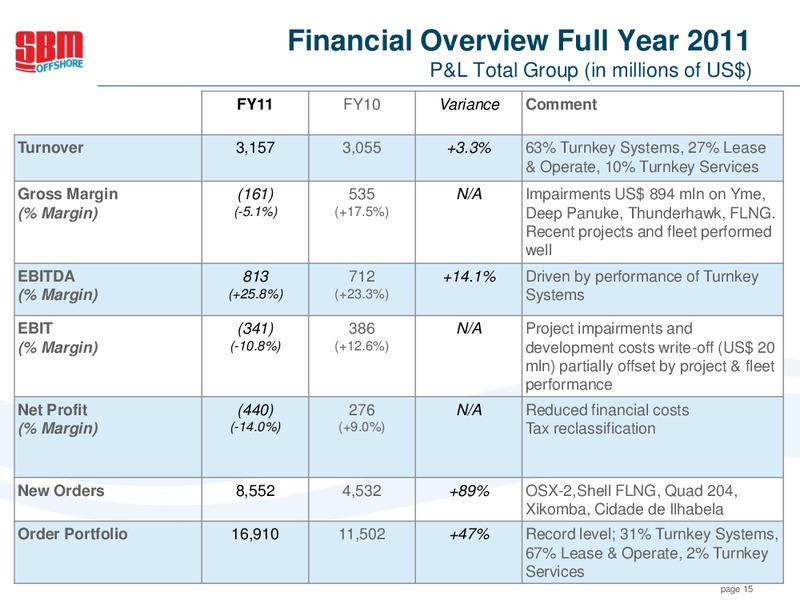
Financial Overview Full Year 2011 P&L Total Group (in millions of US) FY11 FY10 Variance Comment Turnover 3,157 3,055 +3.3% 63% Turnkey Systems, 27% Lease & Operate, 10% Turnkey Services Gross Margin (161) 535 N/A Impairments US 894…
Impairments and Deferrals Total impairment charges and deferrals of US 978 million comprise: previously announced impairment of US 450 million on the Yme MOPUstor and Deep Panuke platform additional impairment of US 407 million on…
Risk management initiatives Project complexity, scale and length require additional safeguard Gate reviews before margins can be recognized at a level of at least 25% No impact on margin or profitability at completion Impact 2012:…
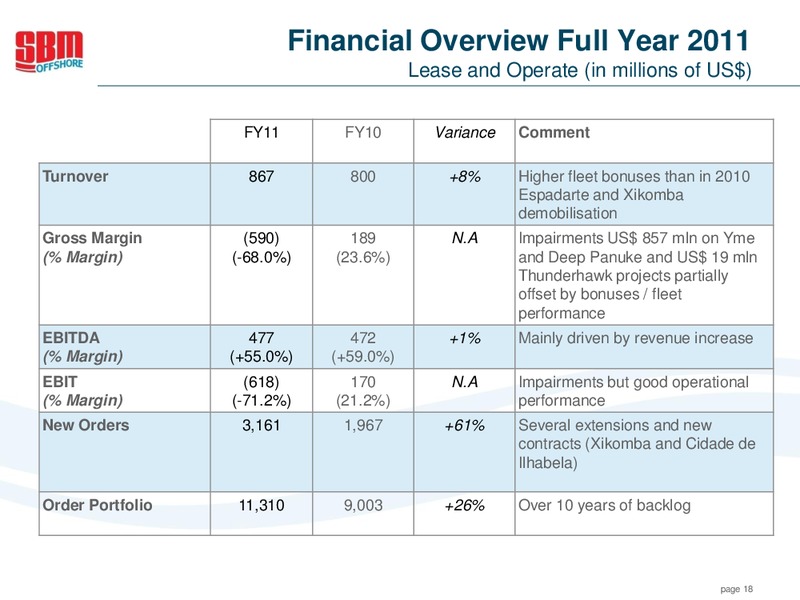
Financial Overview Full Year 2011 Lease and Operate (in millions of US) FY11 FY10 Variance Comment Turnover 867 800 +8% Higher fleet bonuses than in 2010 Espadarte and Xikomba demobilisation Gross Margin (590) 189 N.A Impairments…
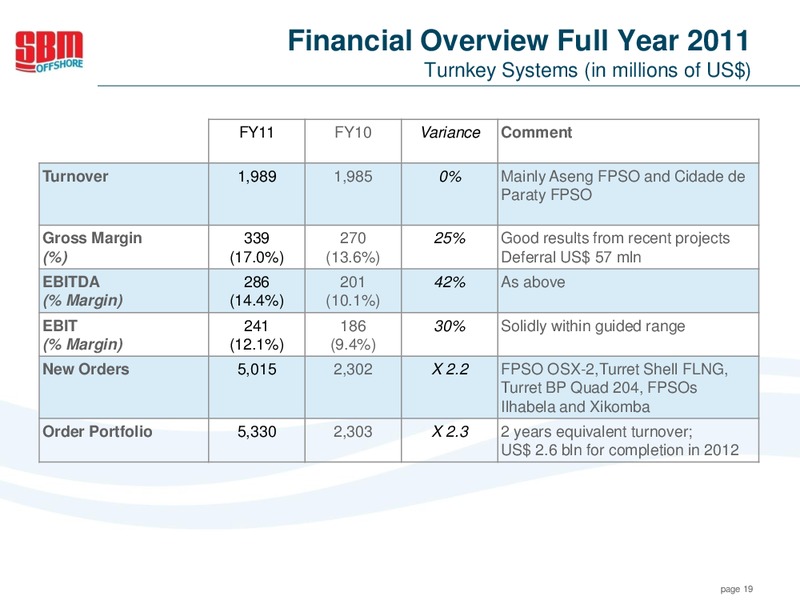
Financial Overview Full Year 2011 Turnkey Systems (in millions of US) FY11 FY10 Variance Comment Turnover 1,989 1,985 0% Mainly Aseng FPSO and Cidade de Paraty FPSO Gross Margin 339 270 25% Good results from recent projects (%)…
Financial Overview Full Year 2011 Turnkey Services (in millions of US) FY11 FY10 Variance Comment Turnover 340 339 0% Even split offshore contracting/supply products & services Gross Margin 90 76 +19% Good vessel utilisation and…
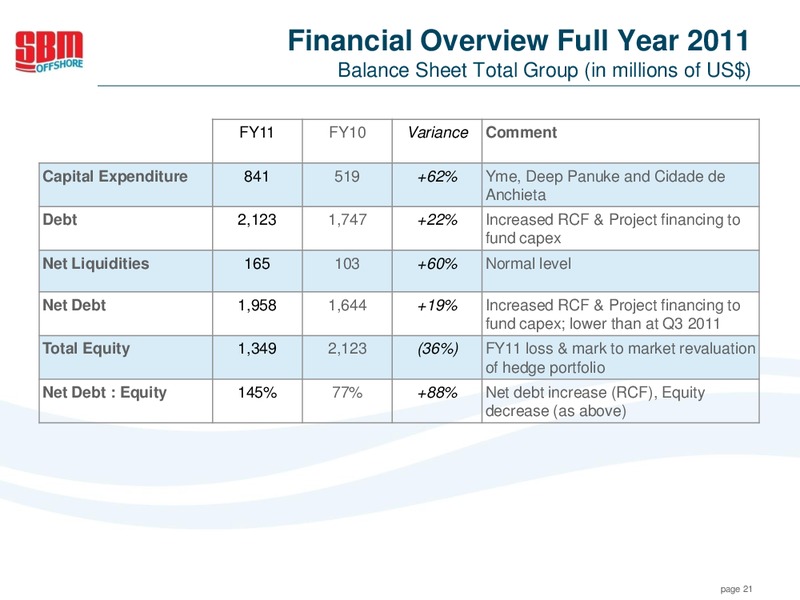
Financial Overview Full Year 2011 Balance Sheet Total Group (in millions of US) FY11 FY10 Variance Comment Capital Expenditure 841 519 +62% Yme, Deep Panuke and Cidade de Anchieta Debt 2,123 1,747 +22% Increased RCF & Project…
Financing capacity Net gearing reached 145% (excluding hedge revaluation: 117%) Still within stated range Relevant banking covenants are all met Revolving Credit Facility - uses adjusted EBITDA (finance leases, exceptionals)…
Order Portfolio BACKLOG (in billions of US) 2012 2013 2014 3.8 3.2 1.6 Turnkey Systems Turnkey Services Lease & Operate Total 2012 2.6 0.3 0.9 3.8 2013 2.1 - 1.1 3.2 2014 0.6 - 1.0 1.6 Beyond 2014 - 8.3 8.3 Total 5.3 0.3…
2011 Review 2011 Financials Outlook page 24
FPSO market outlook Field developments with FPSOs over the next 3 years The FPSO market outlook is buoyant page 25
Financial Outlook 2012 Turnover in the region of US 4 billion Turnkey Systems EBIT margin around 10%, new margin recognition principles will defer around US 100 million from 2012 to future years Turnkey Services EBIT margin in the…
 Loading...