Skip to main content Q1 2013 CONFERENCE CALL – Helix Energy Solutions Investor Presentation | Shale Experts
Loading...

Q1 2013 CONFERENCE CALL – Helix Energy Solutions

Helix Energy Solutions · Apr 22, 2013 · 23 slides

Investor presentation from the Shale Experts oil & gas presentation and slide database. Every page is imaged and its text indexed for search across operators, plays, basins and time.

Slides

  1. Q1 2013 CONFERENCE CALL – Helix Energy Solutions – slide 1
    First Quarter 2013 Conference Call April 22, 2013
  2. Q1 2013 CONFERENCE CALL – Helix Energy Solutions – slide 2
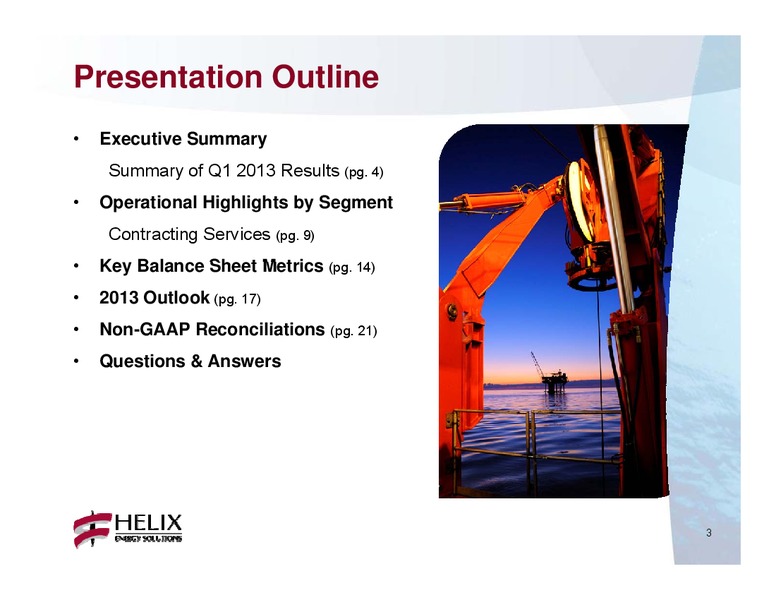
    Presentation Outline Executive Summary Summary of Q1 2013 Results (pg. 4) Operational Highlights by Segment Contracting Services (pg. 9) Ke Balance Sheet Metrics (pg. Key ( 14) 2013 Outlook (pg. 17) Non-GAAP Reconciliations (pg…
  3. Q1 2013 CONFERENCE CALL – Helix Energy Solutions – slide 3
    Executive Summary 4
  4. Q1 2013 CONFERENCE CALL – Helix Energy Solutions – slide 4
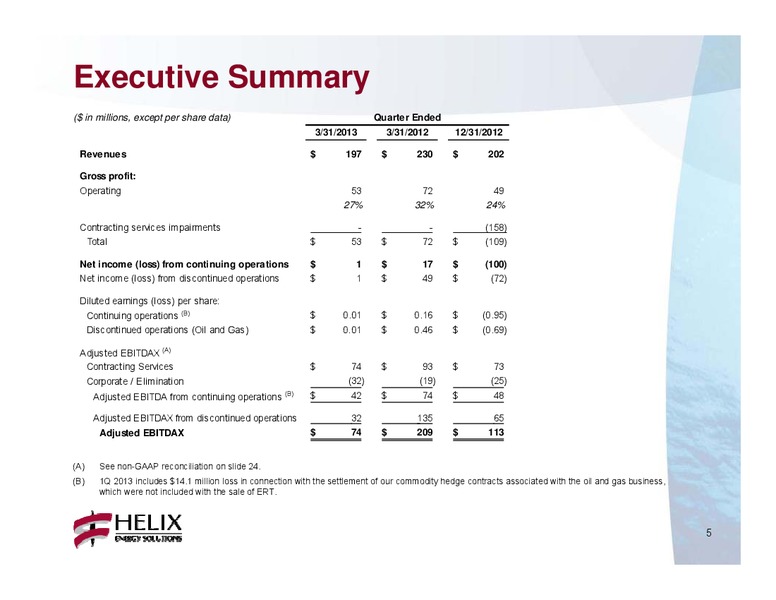
    Executive Summary ( in millions, except per share data) Quarter Ended 3/31/2013 3/31/2012 12/31/2012 Revenues 197 230 202 Gross profit: Operating 53 72 49 27% 32% 24% Contracting services impairments - - (158) Total 53 72…
  5. Q1 2013 CONFERENCE CALL – Helix Energy Solutions – slide 5
    Executive Summary Q1 2013 earnings (loss) per share of 0.02 per diluted share compared with (1.64) per diluted share in Q4 2012 o 22.7 million loss related to the sale of our oil and gas business and associated divestiture costs o…
  6. Q1 2013 CONFERENCE CALL – Helix Energy Solutions – slide 6
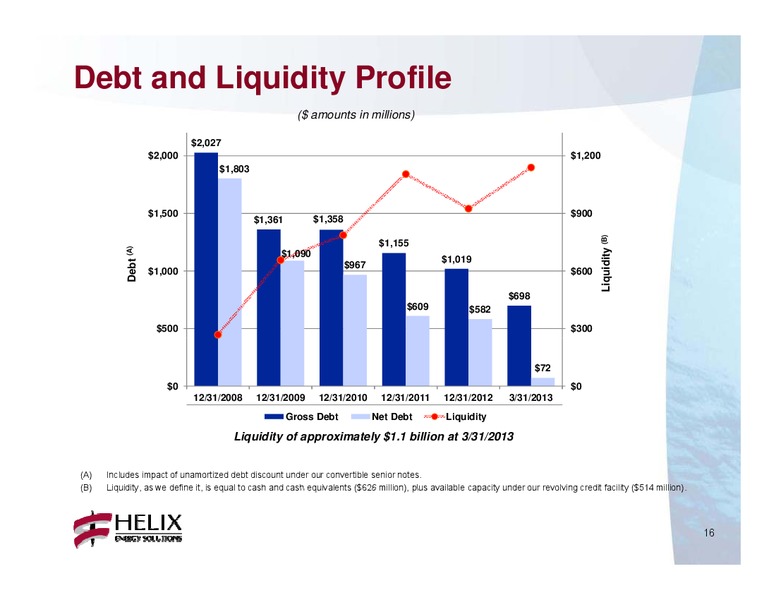
    Executive Summary Balance sheet o Cash increased to 626 million at 03/31/2013 from 437 million at 12/31/2012 o Liquidity* at 1.1 billion at 03/31/2013 o Net debt decreased to 72 million at 03/31/2013 from 582 million at 12/31/2012…
  7. Q1 2013 CONFERENCE CALL – Helix Energy Solutions – slide 7
    Operational p Highlights 8
  8. Q1 2013 CONFERENCE CALL – Helix Energy Solutions – slide 8
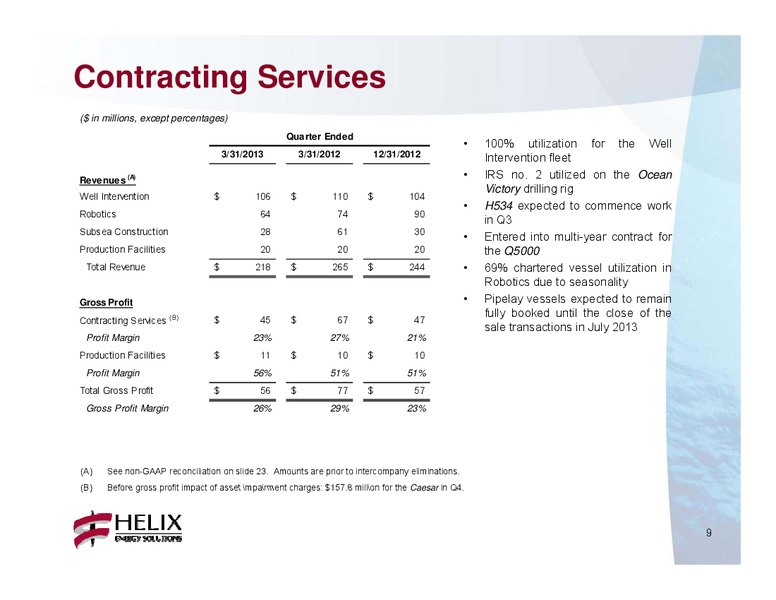
    Contracting Services ( in millions, except percentages) Quarter Ended 100% utilization for the Well 3/31/2013 3/31/2012 12/31/2012 Intervention fleet Revenues (A) IRS no. 2 utilized on the Ocean Victor drilling rig Victory Well…
  9. Q1 2013 CONFERENCE CALL – Helix Energy Solutions – slide 9
    Contracting Services Well Ops GOM Q4000 100% utilized during Q1 IRS no. 2 utilized for 59 days onboard the Ocean Victory d ring the q during quarter arter Helix 534 remains on schedule for Q3 with full backlog the remainder of…
  10. Q1 2013 CONFERENCE CALL – Helix Energy Solutions – slide 10
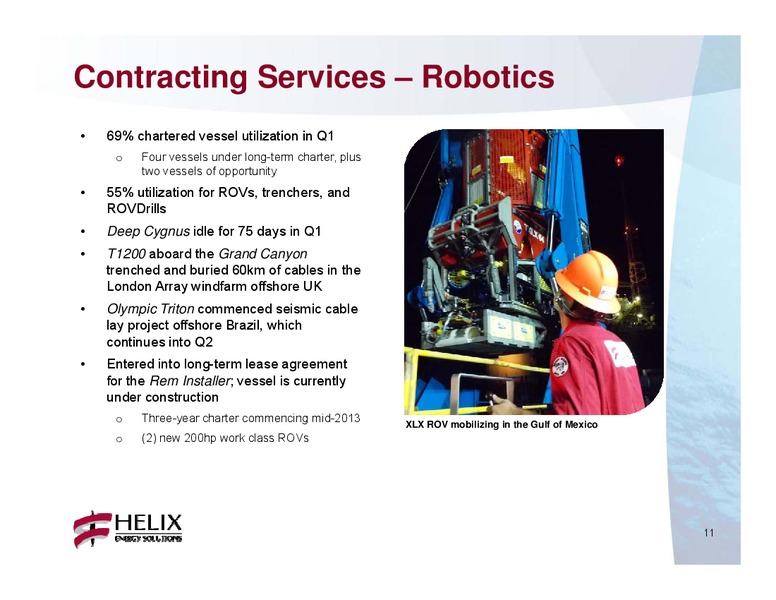
    Contracting Services Robotics 69% chartered vessel utilization in Q1 o Four vessels under long-term charter, plus two vessels of opportunity 55% utilization for ROVs, trenchers, and ROVDrills Deep Cygnus idle for 75 days in Q1…
  11. Q1 2013 CONFERENCE CALL – Helix Energy Solutions – slide 11
    Contracting Services Subsea Construction Express had 80% utilization in Q1 working in the GOM Caesar had 100% C % utilization in Q1 Q working in Mexicos Bay of Campeche on accommodations project Sales of both pipelay assets…
  12. Q1 2013 CONFERENCE CALL – Helix Energy Solutions – slide 12
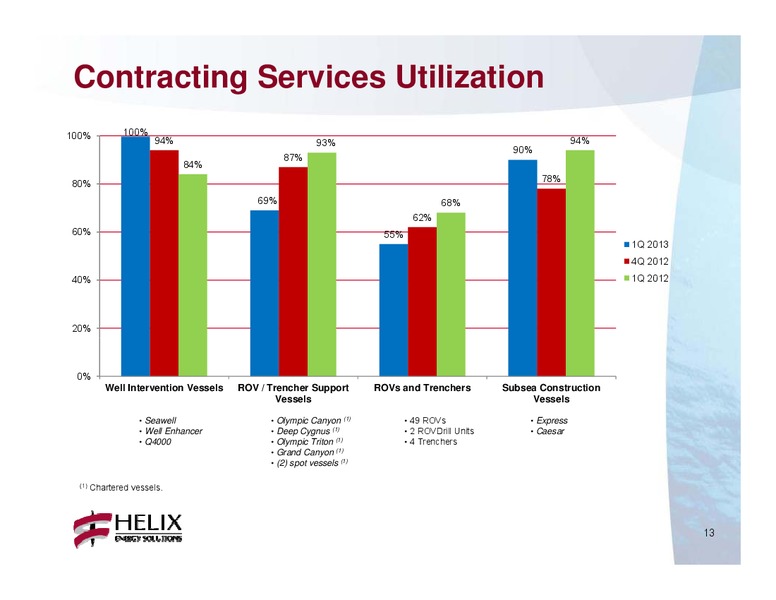
    Contracting Services Utilization 100% 100% 94% 93% 94% 90% 87% 84% 78% 80% 69% 68% 62% 60% 55% 1Q 2013 4Q 2012 40% 1Q 2012 20% 0% Well Intervention Vessels ROV / Trencher Support ROVs and Trenchers Subsea Construction…
  13. Q1 2013 CONFERENCE CALL – Helix Energy Solutions – slide 13
    Key Balance Sheet Metrics 14
  14. Q1 2013 CONFERENCE CALL – Helix Energy Solutions – slide 14
    Debt Maturity Profile Total funded debt of 728 million at end of Q1 Maturity Profile at 3/31/2013 ( amounts in millions) 2013 consisting of: 200 million Convertible Senior Notes 3.25% (A) 300 (170 million net of unamortized debt…
  15. Q1 2013 CONFERENCE CALL – Helix Energy Solutions – slide 15
    Debt and Liquidity Profile ( amounts t iin millions) illi ) 2,027 2,000 1,200 1,803 1,500 900 1,361 1,358 dity (B) 1,155 Debt (A) 1,090 1,019 Liquid 967 1,000 600 698 609 582 500 300 72 0 0…
  16. Q1 2013 CONFERENCE CALL – Helix Energy Solutions – slide 16
    2013 O Outlook tl k 17
  17. Q1 2013 CONFERENCE CALL – Helix Energy Solutions – slide 17
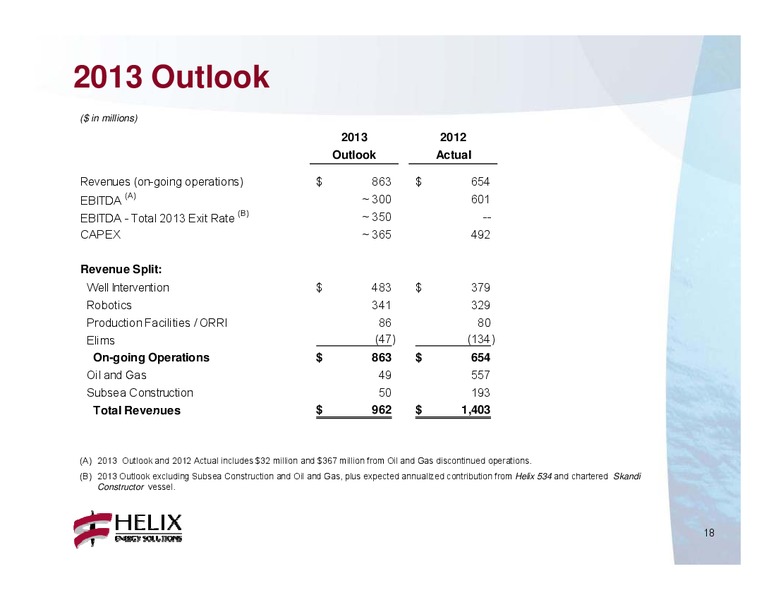
    2013 Outlook ( in millions) 2013 2012 Outlook Actual Revenues ((on-going g g operations) p ) 863 654 (A) EBITDA 300 601 (B) EBITDA - Total 2013 Exit Rate 350 -- CAPEX 365 492 Revenue Split: Well Intervention 483 379 Robotics…
  18. Q1 2013 CONFERENCE CALL – Helix Energy Solutions – slide 18
    2013 Outlook Contracting Services o Backlog as of March 31, 2013 was 1.6 billion (pro forma for Q4000 and Q5000 multi-year contracts signed the first week in April) o Utili ti expected Utilization t d tto remain i strong t ffor th…
  19. Q1 2013 CONFERENCE CALL – Helix Energy Solutions – slide 19
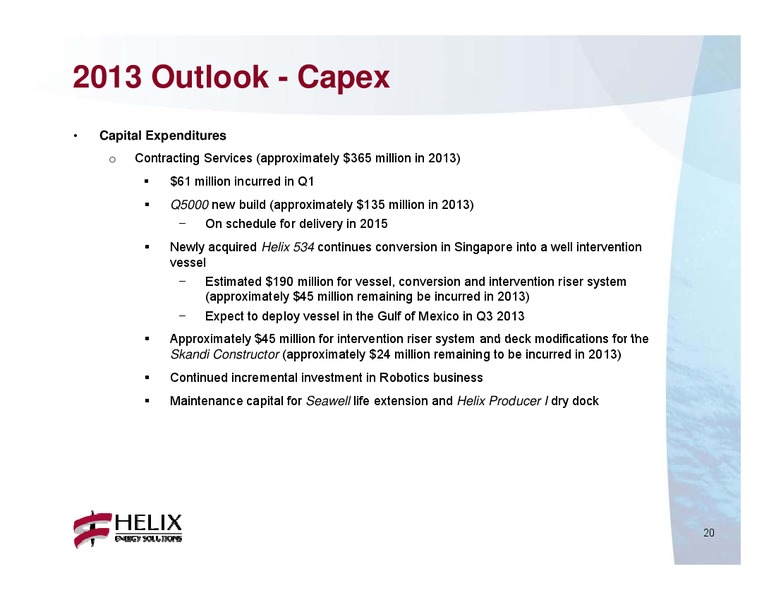
    2013 Outlook - Capex Capital Expenditures o Contracting Services (approximately 365 million in 2013) 61 million incurred in Q1 Q5000 new build (approximately 135 million in 2013) On schedule for delivery in 2015 Newly acquired…
  20. Q1 2013 CONFERENCE CALL – Helix Energy Solutions – slide 20
    Non-GAAP Non GAAP Reconciliations 21
  21. Q1 2013 CONFERENCE CALL – Helix Energy Solutions – slide 21
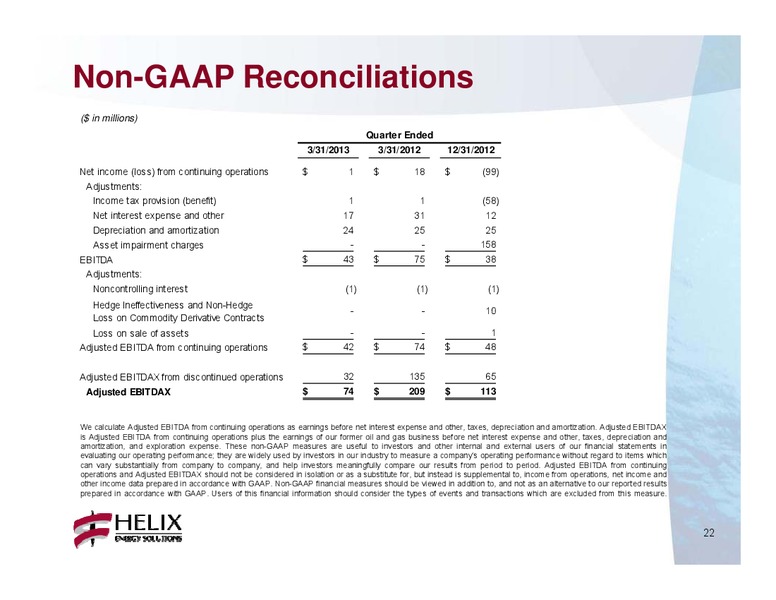
    Non-GAAP Reconciliations ( in millions) Quarter Ended 3/31/2013 3/31/2012 12/31/2012 Net income (loss) from continuing operations 1 18 (99) Adjustments: Income tax provision (benefit) 1 1 (58) Net interest expense and other 17 31…

  22. Q1 2013 CONFERENCE CALL – Helix Energy Solutions – slide 22
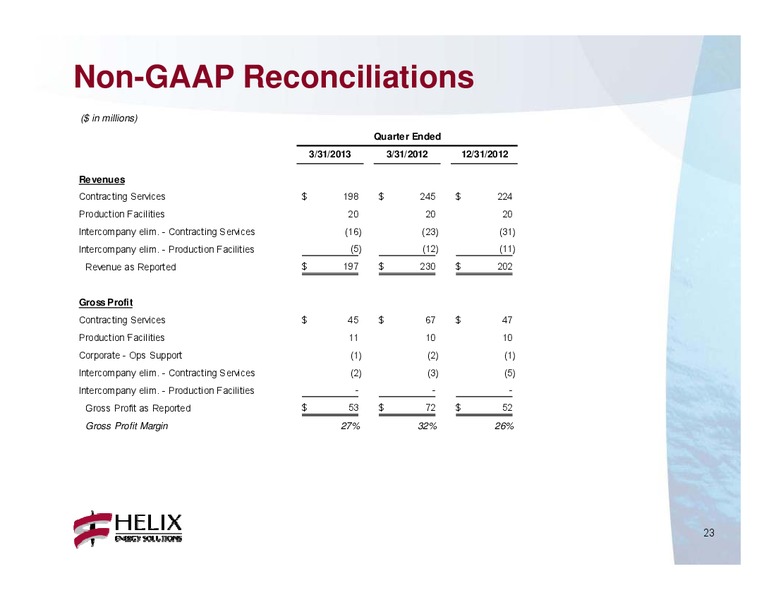
    Non-GAAP Reconciliations ( in millions) Quarter Ended 3/31/2013 3/31/2012 12/31/2012 Revenues Contracting Services 198 245 224 Production Facilities 20 20 20 Intercompany elim. - Contracting Services (16) (23) (31) Intercompany elim. -…
  23. Q1 2013 CONFERENCE CALL – Helix Energy Solutions – slide 23
    Follow Helix ESG on Twitter: www.twitter.com/Helix_ESG Join the discussion on LinkedIn: www.linkedin.com/company/helix 24 24

From the store

Browse maps, data & reports in the Shale Experts store