Johnson Rice & Company 2013 Energy Conference October 1, 2013 0
Franks: A Leading Global Provider of Tubular Services Franks Financial Results Tubular Services Critical to Drilling Franks is a Market Leader Demonstrate Value and Completion 1 or 2 market share in all 1,056 mm of revenue in 3.3…
75 Years of Growth and Innovation Franks Casing Active period for IPO Began international expansion Crew established acquisitions 1938 1973 1981 1990s 2000s 2012 2013 Began domestic expansion Numerous innovative 1bn in revenue and…
Leading Producers Trust Franks With Their Largest Projects Selected Examples of Our Diverse Customer Base(1) 1) Only one customer exceeded 10% of revenues in 2012 (at approximately 11%). 4
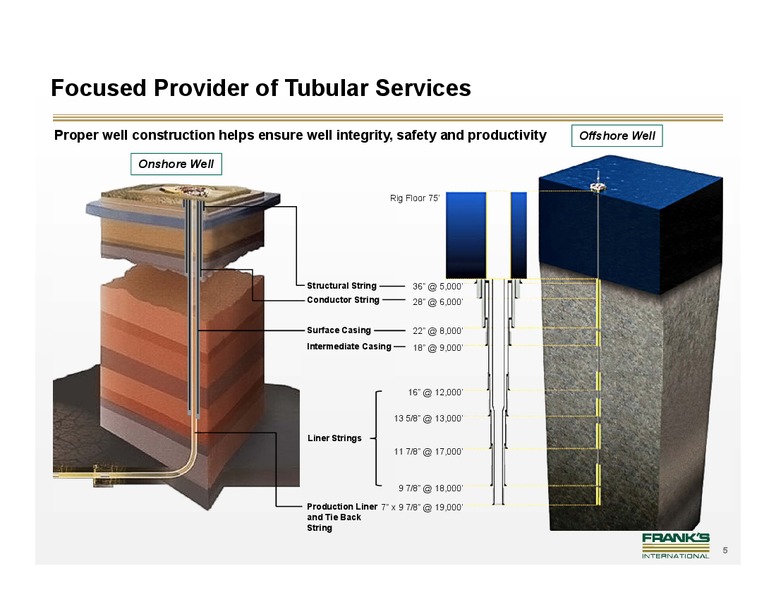
Focused Provider of Tubular Services Proper well construction helps ensure well integrity, safety and productivity Offshore Well Onshore Well Rig Floor 75 Structural String 36 5,000 Conductor String 28 6,000 Surface Casing 22…
Our Tools Enable Innovations in Well Development Over 100 patents issued and 37 patents pending Innovation Franks Proprietary Tools Deeper water Deeper wells Very heavy casing and landing strings Dual mast rigs, Offshore…
Pipe & Products Segment (Tubular Sales) Utilizes our expertise in deep water tubulars and complements our service business Large OD Pipe and Tendons Connectors We specialize in large OD pipe for conductor casing and TLP We…
Attractive End Markets Driven by Energy Growth and Development Projected Global Energy Demand DW Rigs - 5 Largest Offshore Drillers ( rigs) Mtoe 180 162 20,000 150 113 18,000 120 90 16,000 60 14,000 30 0 12,000 2012…
Global Footprint Provides Access to Attractive Markets 2012 Casing And Tubing Running Market Share(1) Frank's Market Position % Share Weatherford Others International Offshore 1 31% 27% 42% North America Offshore 2 26% 45% 30%…
Franks is the Leading Choice for Complex Well Solutions Selected customer case studies Deepest Completed Well Greatest Hook Load Macondo Relief Well Shah Deniz Project Casing and landing string Broke our own record for Provided all…
Strong Position in Deep Water Markets More than 60% of deep water reserves currently have appraisal, developing or discovery status(1) Typical Industry Casing Costs per Well(2) Franks Offshore Exposure (% of Total Revenue) (000)…
Financial Overview 13
Financial Highlights Long History of Top-line Growth and Strong Margins All organic growth since 2009, not from acquisitions Minimal Ongoing Maintenance Capital Expenditure Requirements Historically has averaged 5-7% of…
Attractive Financial Results Reflect Value of Our Services Revenue and margin growth without incurring leverage GOM Deep Water Rigs(1) 35 40 30 23 1,200 50% 20 7 1,056 0 2009 2010 2011 2012 900 42% 40% (% Adj EBITDA…
Pro Forma Capitalization As of June 30, 2013 Distribution of Offering Assets and Reorganization FINV Related FINV As FINV Historical Liabilities Transactions Pro Forma Adjustments Adjusted Cash and cash equivalents 106,007 - -…
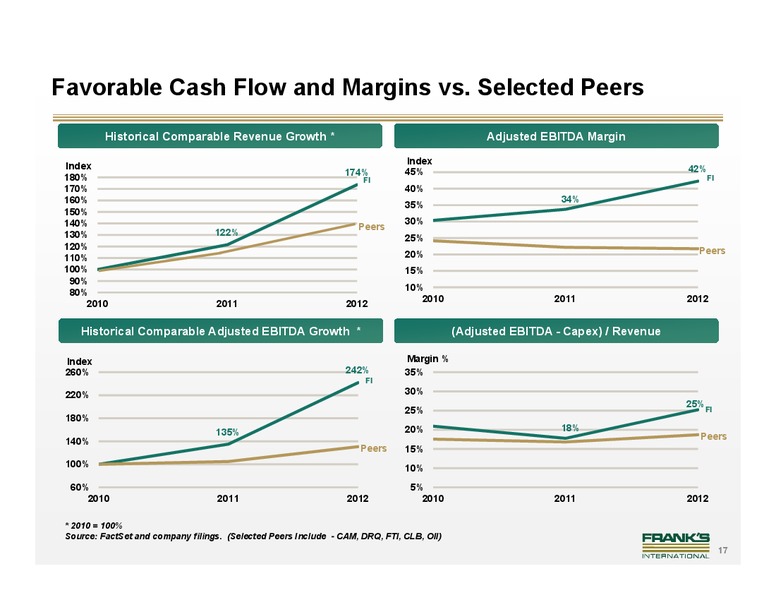
Favorable Cash Flow and Margins vs. Selected Peers Historical Comparable Revenue Growth * Adjusted EBITDA Margin Index Index 42% 174% 45% 180% FI FI 170% 40% 160% 34% 35% 150% 140% 30% Peers 130% 122% 25% 120% Peers 110%…
Dividend Yield vs. Selected Peers LQA Dividend Yield % Yield* 1.50% 1.09% 1.03% 1.00% 0.77% 0.50% NA NA NA 0.00% FI CAM DRQ FTI CLB OII * as of 09/25/2013 18
Investment Highlights Attractive End-Markets Driven by Continued Oil & Gas Exploration and Development Global Market Leader Focused Service Provider with Unique Engineering Capabilities and Favorable Reputation Strong Position…
Appendix 20
Overview of UP-C Structure Mosing Family FWW Public B.V. Investors International structure functions for 119,024,000 shares of common stock 30,000,000 shares of common stock investors similar to traditional C-Corp (representing…
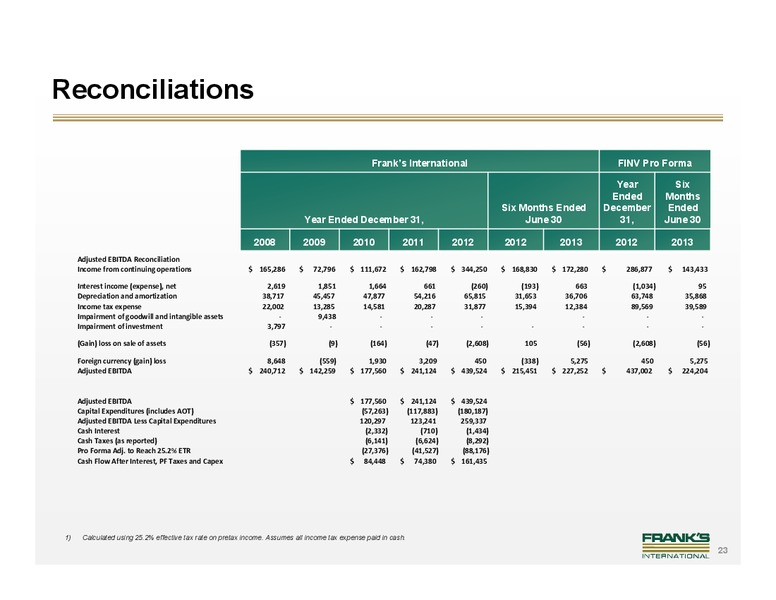
Reconciliations Franks International FINV Pro Forma Year Six Ended Months Six Months Ended December Ended Year Ended December 31, June 30 31, June 30 2008 2009 2010 2011 2012 2012 2013 2012 2013 Adjusted EBITDA Reconciliation…
Consolidated Statements of Operations Franks International FINV Pro Forma Year Six Ended Months Six Months December Ended Year Ended December 31, Ended June 30, 31, June 30, 2008 2009 2010 2011 2012 2012 2013 2012 2013 Revenues:…
Financial Results by Segment Year Ended December 31, Six Months Ended June 30, 2010 2011 2012 2012 2013 Revenue International Services 289,597 366,106 469,464 224,398 232,807 U.S. Services 231,913 277,286 444,568 212,477 223,499…
Experienced Leadership Team Chairman of the Board, CEO and President D. Keith Mosing of Franks International since 1981 Chairman, CEO and 40+ years of industry experience President 40+ years with Franks International John Walker…
 Loading...