Third Quarter 2014 Financial highlights October 24, 2014 BASF with higher sales and earnings despite declining demand
Q3 2014: BASF with higher sales and earnings despite declining demand Business performance Q314 vs. Q313 Q1-Q314 vs. Q1-Q313 Sales 18.3 billion +3% 56.3 billion +1% EBITDA 2.5 billion +1% 8.2 billion +4% EBIT before special items…
Sales analysis: BASF without Oil & Gas Chemical business: no volume growth, stable prices Factors influencing sales in Q3 2014 vs. Q3 2013 10% Volume Price Currency Portfolio 8% 7% 6% BASF Group: Sales: +3% 4% BASF Group w/o Oil…
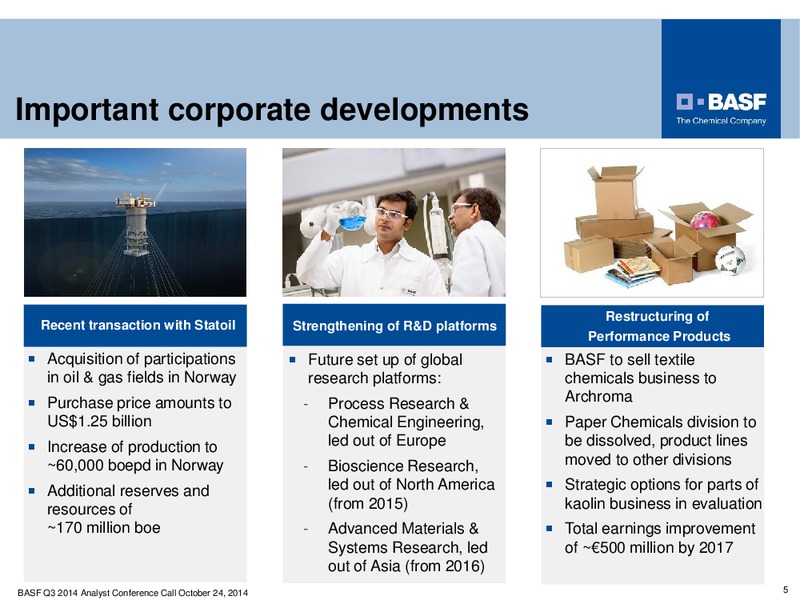
Important corporate developments Restructuring of Recent transaction with Statoil Strengthening of R&D platforms Performance Products Acquisition of participations Future set up of global BASF to sell textile in oil & gas fields…
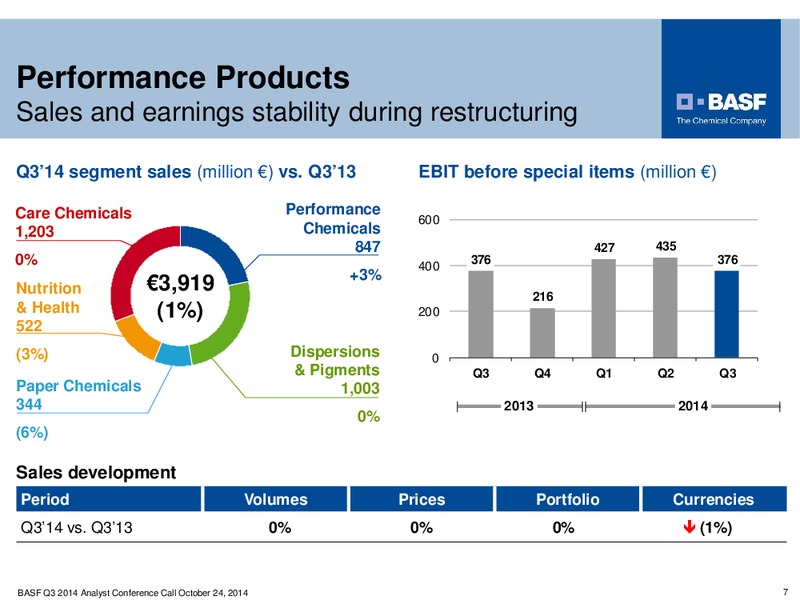
Performance Products Sales and earnings stability during restructuring Q314 segment sales (million ) vs. Q313 EBIT before special items (million ) Care Chemicals Performance 600 1,203 Chemicals 847 427 435 0% 400 376 376 +3%…
Functional Materials & Solutions Continued robust demand from automotive Q314 segment sales (million ) vs. Q313 EBIT before special items (million ) Performance Construction Chemicals 400 356 Materials 300 311 310 1,654 565 238 (1%)…
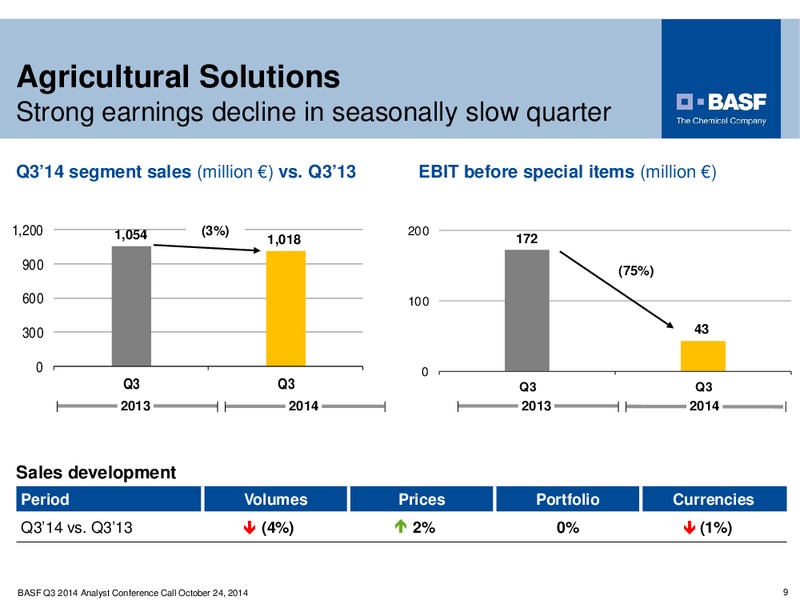
Agricultural Solutions Strong earnings decline in seasonally slow quarter Q314 segment sales (million ) vs. Q313 EBIT before special items (million ) 1,200 1,054 (3%) 200 1,018 172 900 (75%) 600 100 300 43 0 0 Q3 Q3 Q3 Q3…
Oil & Gas Considerably higher sales and earnings Q314 segment sales (million ) vs. Q313 EBIT bSI/Net income (million ) Natural Gas Exploration & 504 Trading Production 500 451* 3,059 611 422 400 +29% (19%) 310 3,670 300 265 360…
Review of Other Million Q314 Q313 Sales 977 947 EBIT before special items (7) (105) Thereof Corporate research (96) (90) Group corporate costs (53) (57) Currency result, hedges and other 100 (74) valuation effects Other business…
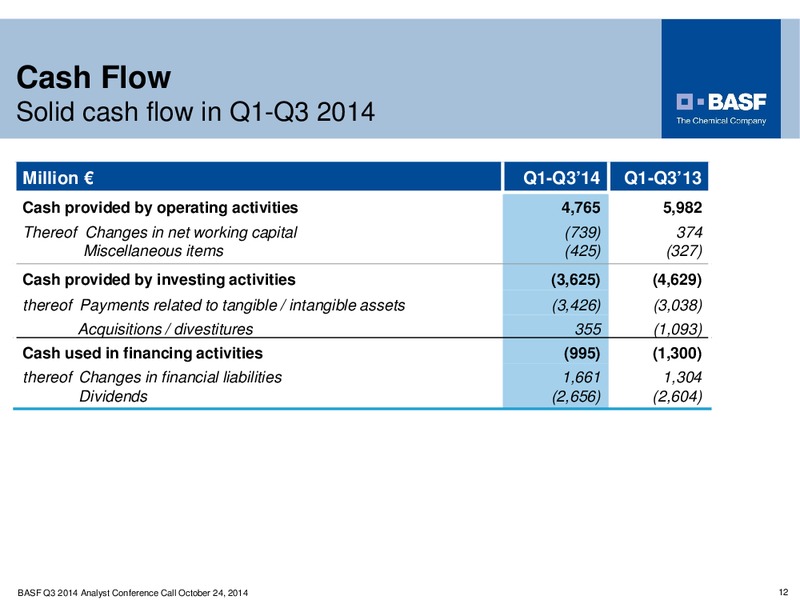
Cash Flow Solid cash flow in Q1-Q3 2014 Million Q1-Q314 Q1-Q313 Cash provided by operating activities 4,765 5,982 Thereof Changes in net working capital (739) 374 Miscellaneous items (425) (327) Cash provided by investing activities…
Outlook 2014 Outlook 2014 We aim to increase our sales volumes excluding the effects of acquisitions and divestitures. Nonetheless, sales will decline slightly compared with 2013 due to the divestiture of the gas trading and storage…
Update on key assumptions of the We create chemistry strategy Growth 2010 2015 Growth 2010 2015 (We create chemistry *) (todays view) Global GDP 3.4% p.a. 2.6% p.a. Chemical production 4.9% p.a. 4.0% p.a. (excl. pharma) Industrial…
 Loading...