Wood Group 2011 Final Results Energy Supporting Energy March 2012
Agenda Highlights Financial review Divisional review Key takeaways Presenters Sir Ian Wood (Chairman) ( ) Allister Langlands (Chief Executive) Alan Semple (CFO) 2
Highlights Completed strategic moves to enhance focus and market-leading positions in engineering, production facilities support and gas turbine services activities acquisition i iti off PSN (1b (1bn)) disposal of Well Support…
Oil & Gas and Power markets Strong oil & gas market Challenging economic conditions for power customers Engineering: Growth in E&P spend forecast of around 5% - 10% in 2012, directed towards increasingly complex engineering…
Refocused g group p strategy gy To achieve long term sustainable growth as an international energy services company We will - maintain a balance between development and later cycle production support - grow and maintain…
Financial results 2011 2010 Change Ch m m % Total revenue 6,052 5,063 20% Revenue from continuing operations 5,667 4,085 39% Total EBITA 399 345 16% EBITA from continuing operations 342 219 56% Amortisation (79) (29) Net finance…
Pro forma financial results 2011 2010 m m Revenue EBITA Margin Revenue EBITA Margin Engineering 1,459 162 11.1% 1,239 122 9.8% Wood Group PSN 3,376 175 5.2% 3,215 198 6.2% Wood Group GTS 1,195 79 6.6% 805 46 5.7% Central costs…
Amortisation PSN acquisition m Enterprise value 1,055 Net assets acquired (42) 1,013 Represented by: Goodwill 818 Intangible assets arising on acquisition (to be amortised over 5 years) 195 Amortisation Amortisation on…
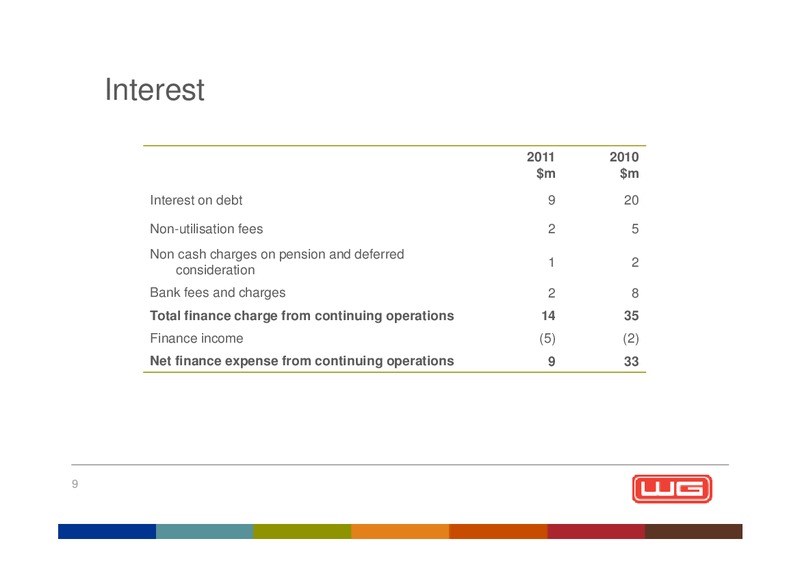
Interest 2011 2010 m m Interest on debt 9 20 Non-utilisation fees 2 5 Non cash charges on pension and deferred 1 2 consideration Bank fees and charges 2 8 Total finance charge from continuing operations 14 35 Finance income…
Tax 2011 2010 m m Profit from continuing operations before tax 254 156 Add amortisation on intangible g assets arising g on - 11 acquisition Adjusted Profit 254 167 U d l i tax Underlying t charge h 92 58 Credit in…
Exceptional items 2011 m Business divested or to be divested 2,294 Acquisition costs (16) Integration and restructuring charge (84) Political disruption ( ) (13) Impairment of goodwill (46) Total exceptional items before…
Cash flow 2011 2010 m m EBITA 399 345 Depreciation & other non cash items 73 77 Cash generated pre working capital 472 422 Working capital movements (continuing operations) (109) 24 Working capital movements (discontinued…
Working capital Closing Net Working Capital / Last six months sales 20.0% 19.0% 18.0% 17.0% 16.0% Continuing 15.0% Group 14.0% 13.0% 12.0% 11.0% 10 0% 10.0% Dec-06 Dec-07 Dec-08 Dec-09 Dec-10 Dec-11 Working capital…
Balance sheet 2011 2010 m m Non current assets 1,874 1,059 Net current assets 344 541 Long term liabilities (240) (168) Net operating assets 1,978 1,432 Net borrowings (4) (15) N t assets Net t 1 974 1,974 1 417 1,417 Non…
Engineering 2011 2010 % change m m Revenue 1,459 1,239 18% EBITA 162 122 33% Margin 11.1% 9.8% 1.3pts Revenue up 18% reflecting increased activity in upstream and subsea & pipelines, downstream, process & industrial in…
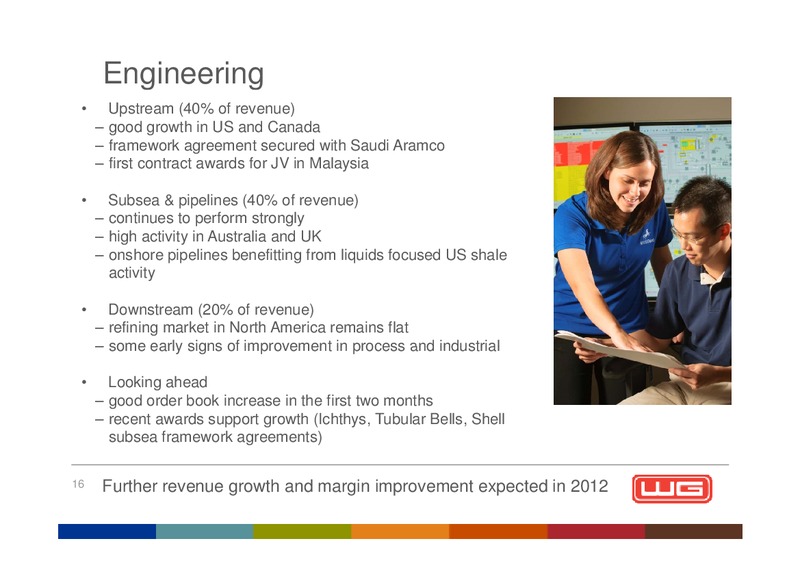
Engineering Upstream (40% of revenue) good growth in US and Canada framework agreement secured with Saudi Aramco first contract awards for JV in Malaysia Subsea & pipelines (40% of revenue) continues to perform strongly high…
Wood Group PSN 2011 2010 % m m change Revenue 3,013 2,041 48% Pro forma Revenue 3,376 3,215 5% EBITA 153 101 51% Pro forma EBITA 175 198 (12%) Margin 5.1% 5.0% 0.1pts Pro forma Margin 5.2% 6.2% (1.0% pts) Revenue up 48% and…
Wood Group PSN Losses in Oman and Colombia of around 30m in total; Oman will continue to impact at a reduced level in 2012 Oman (PDO): start up and mobilisation losses - low utilisation of field crew - difficulties in hiring…
Wood Group p PSN North Sea (40% of revenue) - strong activity levels expected to continue - contract extensions with Shell, Talisman, TAQA and Premier Oil Americas (30% of revenue) - offshore GoM performing well - goodd growth…
Wood Group GTS 2011 2010 % change m m Revenue 1,195 805 49% EBITA 79 46 71% Margin 6.6% 5.7% 0.9% pts Maintenance revenue up 10% to 784m and maintenance EBITA up over 20%; benefitting from operating efficiency and product…
Wood Group GTS Maintenance - Oil & Gas - improved performance - good performance in Iraq - enhanced operating efficiency and product capability Maintenance - Power - market remained challenging - formed strategic alliance with…
Key Takeaways Continuing Group pro forma revenue up 15% to 6.0bn. Continuing Group pro forma EBITA up 15% to 364m Completed strategic moves to enhance focus and market-leading positions in engineering, production facilities support…
Footnotes 1. EBITA from continuing operations represents operating profit from continuing operations pre exceptional items of 262.9m (2010: 189.7m) before the deduction of amortisation of 78.7m (2010: 29.0m) and is provided as it is a…
Appendix 24
Reconciliation of pro forma financial results 2011 2010 m m Revenue EBITA Margin Revenue EBITA Margin Engineering 1,459 162 11.1% 1,239 122 9.8% Wood Group PSN 3,376 175 5.2% 3,215 198 6.2% Wood Group GTS 1,195 79 6.6% 805 46…
Share numbers 2011 2011 Closing Weighted average Ordinary shares opening balance 530 530 PSN acquisition 10 7 Tender Offer (66) (38) B/C share issue and share capital consolidation (105) (53) Allocation of shares issued to…
Divisional characteristics and market drivers Typical Share of Group EBITA margin Capex/Opex split Typical contract revenues range (%) duration Backlog range 1 Engineering Upstream c10% Over 10% 90/10 Subsea & Pipelines c10%…
 Loading...