Overview Geographic and sector diversification contributes to solid performance Record aggregated revenue, EBIT flat and NPAT down Hydrocarbons sector revenue and EBIT up Growth in the Chemicals sector more than offset weakness in…
Financial overview Net profit after tax of 322m decreased by 7%* Record aggregated revenue of 7,627m up 4%*, statutory revenue and other income of 8,832m up 19%* EBIT of 527m in line with prior year underlying EBIT EBIT margin…
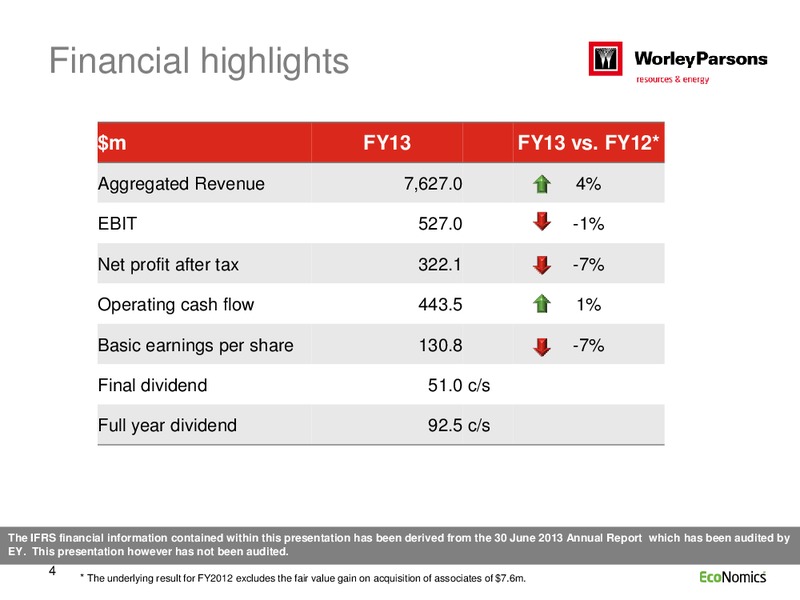
Financial highlights m FY13 FY13 vs. FY12* Aggregated Revenue 7,627.0 4% EBIT 527.0 -1% Net profit after tax 322.1 -7% Operating cash flow 443.5 1% Basic earnings per share 130.8 -7% Final dividend 51.0 c/s Full year…
Financial profile Record aggregated revenue 7 * The underlying result for FY2012 and FY2011 excludes the fair value gain on acquisition of associates of 7.6m and 65.7m respectively
Financial profile Hydrocarbons primary contributor to EBIT growth Global support costs remain flat at approximately 5% of aggregated revenue The effective corporate tax rate was 27.3%, up from 24.1% in FY12 Minimal foreign…
Margin profile Second half EBIT margin of 7.3% up from first half of 6.5% Hydrocarbons professional services EBIT margin increased from 12.3% to 13.1% Minerals, Metals & Chemicals margins steady despite market conditions…
Aggregated Revenue Geographically diverse 10 * Regions in constant currency
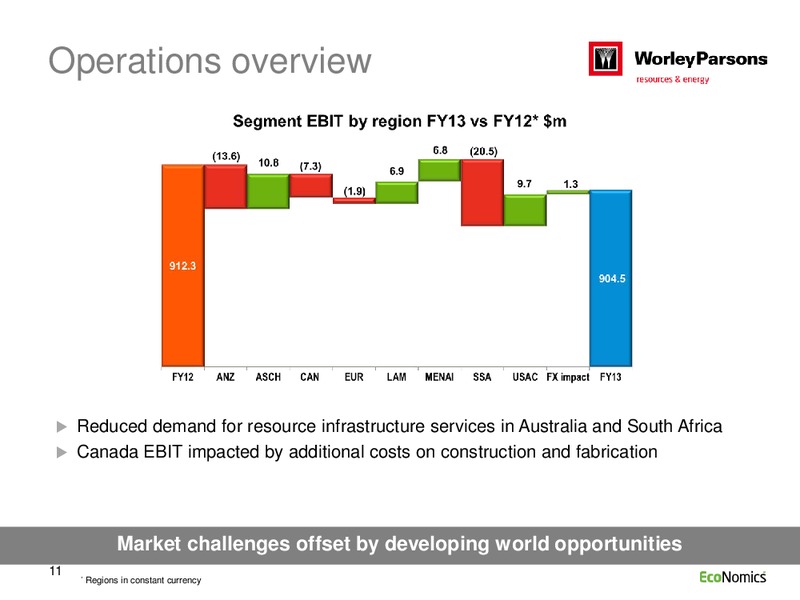
Operations overview Reduced demand for resource infrastructure services in Australia and South Africa Canada EBIT impacted by additional costs on construction and fabrication Market challenges offset by developing world…
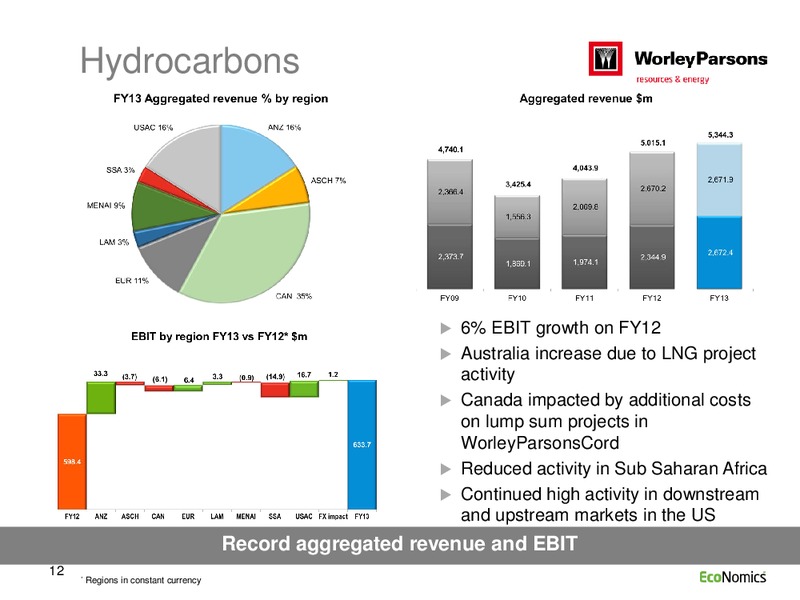
Hydrocarbons 6% EBIT growth on FY12 Australia increase due to LNG project activity Canada impacted by additional costs on lump sum projects in WorleyParsonsCord Reduced activity in Sub Saharan Africa Continued high activity…
Minerals, Metals & Chemicals EBIT growth despite challenging market conditions Growth in chemicals in China and Latin America Australian minerals and metals market conditions deteriorated Further geographical diversification…
Infrastructure & Environment Flow on impact of the deterioration in the Australian resources sector Reduced activity in Canada, Sub Saharan Africa and the US Growth in the Middle East due to increased demand for infrastructure…
Power The Australian power generation asset management business was consolidated into Transfield Worley Power Services Key project cancellation in Canada Europe impacted by the cancellation of a key government project Latin…
Cash Flow m FY09 FY10 FY11* FY12* FY13 EBIT 605 427 474 530 527 Depreciation and amortization 88 92 96 103 102 Interest and tax paid (216) (186) (125) (152) (192) Working capital 74 (63) (140) (60) 20 Other (5) 10 (11) 17…
Gearing and key metrics Key Metrics FY09 FY10 FY11 FY12 FY13 Gearing ratio (net debt / net debt + equity) 26% 26% 22% 20% 25% Facility utilization ** 54% 61% 53% 51% 55% Average cost of debt 5.5% 5.2% 5.7% 5.7% 5.5% Average…
Zero Harm is our goal and to get there we strive for year on year improvement Total Recordable Case Frequency Rate (TRCFR) was 0.13 (FY2012: 0.12) Lost Workday Case Frequency Rate (LWCFR) was 0.03 (same in FY2012) 20% improvement…
Strength in Diversification Through our products Advisory Consult Deliver Improve Through our customer sectors... Minerals, Metals & Infrastructure & Power Hydrocarbons Environment Chemicals 5.7 million workshare Through our…
Significant awards for FY2013 23 Hydrocarbons significant 34 Minerals, Metals & Chemicals projects significant projects Including the following strategic wins: Including the following strategic wins: Maersk General Design Contractor…
Consulting & Advisory Consulting Services: Delivering technical consulting services to add value to our customers businesses Operating across all CSGs, and project phases, drawing on our global expertise Earlier and stronger…
Improve contracts WorleyParsons performance continues to be underpinned by our growing long term contract base 4 new global agreements 35 new Improve contracts awarded 11 Improve contracts renewed this year More than 290 Improve…
Our strategic journey We believe our current 3 year strategy is robust We are continuing our strategic journey by Simplification and discipline Winning the right work and executing it well Continuing to engage closely with our…
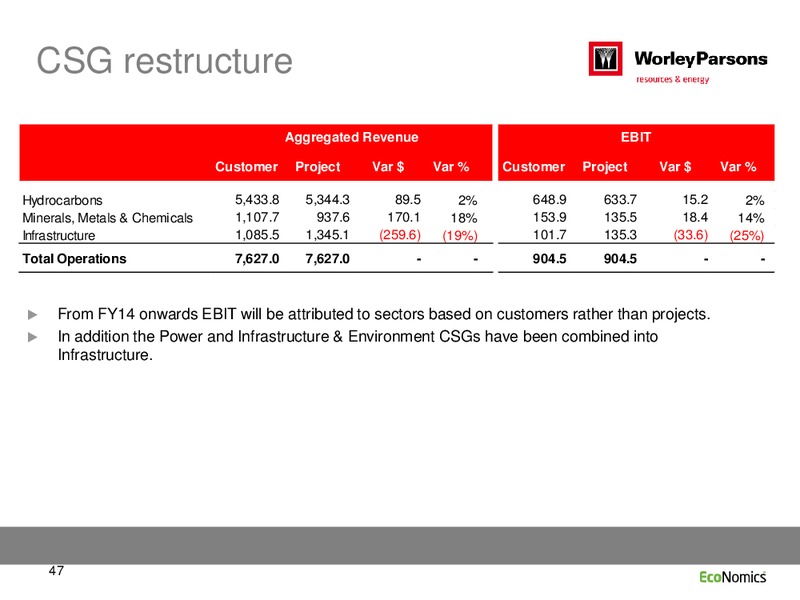
Our strategic journey (continued) Combined existing Power and Infrastructure & Environment sectors into a single CSG called Infrastructure CSG reporting aligned by reference to customers Operational efficiencies implemented…
Corporate Responsibility We continue our journey towards achieving our vision to be a leader in Corporate Responsibility. Revised the Code of Conduct reaffirming the Groups Corporate Responsibility expectations Launching the…
Sector Outlook Andrew Wood
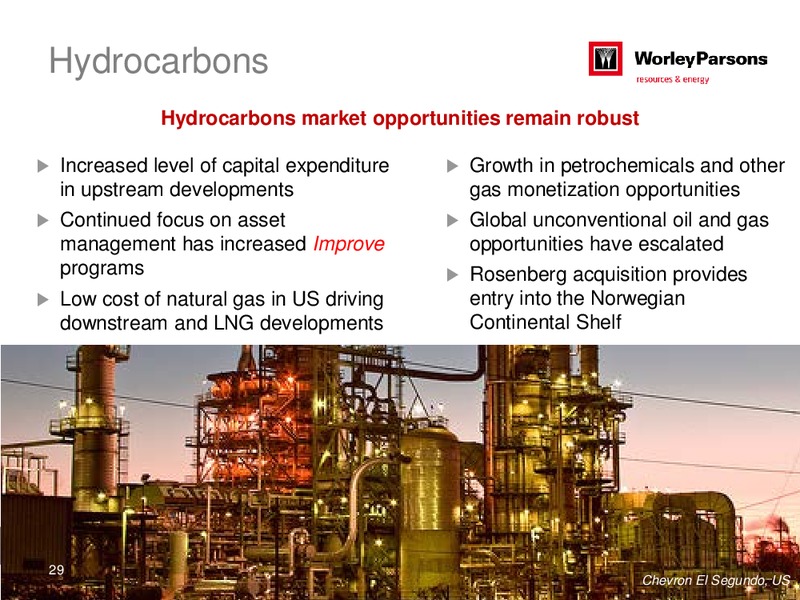
Hydrocarbons Hydrocarbons market opportunities remain robust Increased level of capital expenditure Growth in petrochemicals and other in upstream developments gas monetization opportunities Continued focus on asset Global…
Hydrocarbons Sector outlook Continued growth of the US gas, downstream and petrochemicals market, opportunities in Norway and in the developing world Potential market slowdown in Australia expected to be offset by continued…
Minerals, Metals & Chemicals New developments in the chemicals industry provided growth opportunities Global chemicals market providing Integrated Improve offering growth as opportunities for growth customers focus on efficiency…
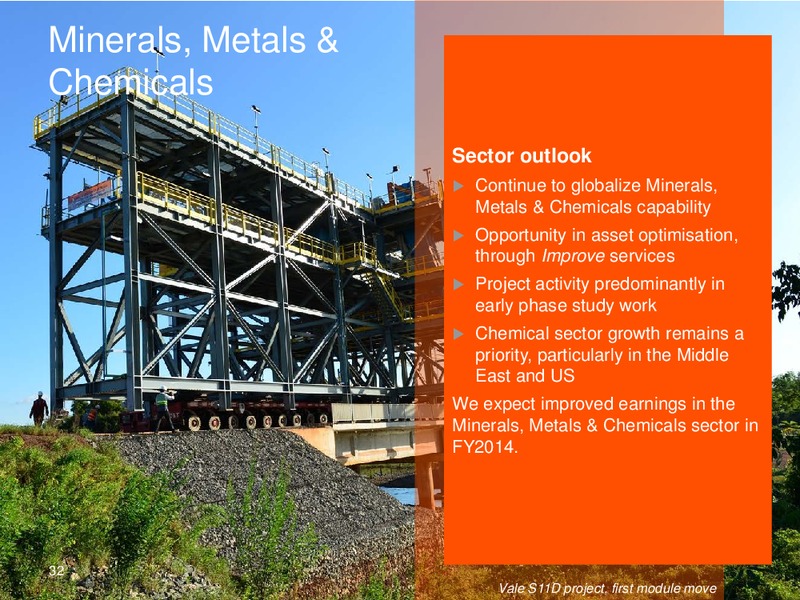
Minerals, Metals & Chemicals Sector outlook Continue to globalize Minerals, Metals & Chemicals capability Opportunity in asset optimisation, through Improve services Project activity predominantly in early phase study work…
Infrastructure & Environment Enabling capabilities that differentiate our business Downturn of the Australian mining sector Expanded geographic presence in the and reduced government spend in South delivery of Restoration services…
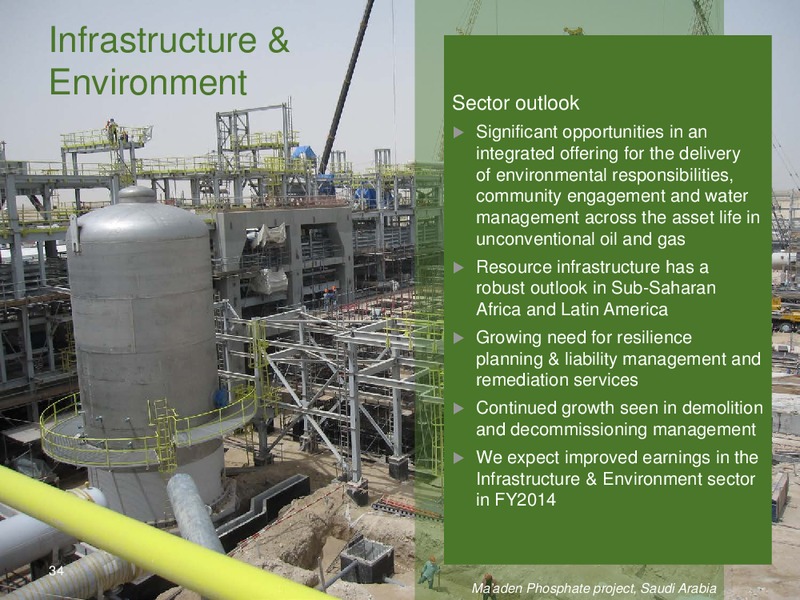
Infrastructure & Environment Sector outlook Significant opportunities in an integrated offering for the delivery of environmental responsibilities, community engagement and water management across the asset life in unconventional…
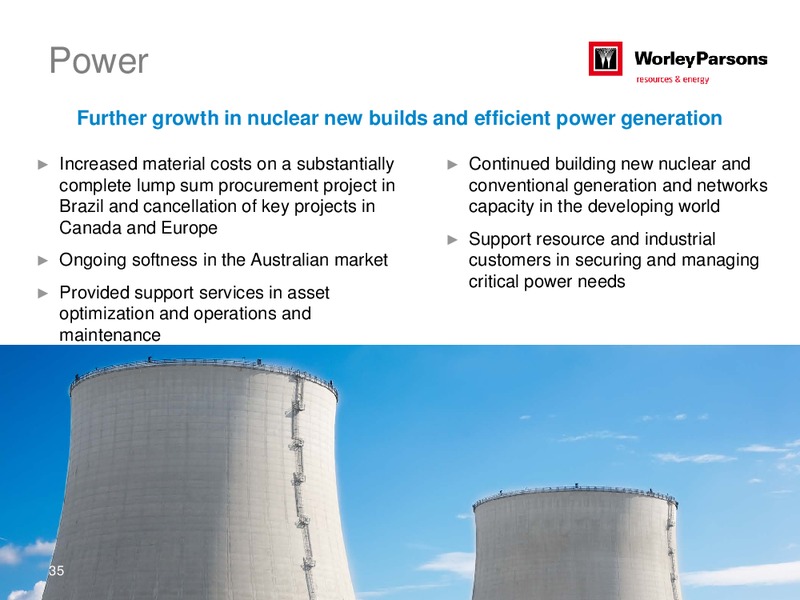
Power Further growth in nuclear new builds and efficient power generation Increased material costs on a substantially Continued building new nuclear and complete lump sum procurement project in conventional generation and networks…
Power Sector outlook Continue to strengthen our relationships with resource and industry customers, leveraging our other customer sector groups New build opportunities in Latin America, South East Asia, Sub Saharan Africa and the…
Summary Aggregated revenue growth across the Strong performance and growth in sector groups despite challenging Hydrocarbons and chemicals sectors conditions in key markets Demand for our Improve offering Increased level of…
Group outlook Commenting on the outlook for the WorleyParsons Group, Mr Andrew Wood said: While recognizing the uncertainties in world markets, we expect our geographic and sector diversification to provide a solid foundation to deliver…
Appendices
FY2013 Significant Awards
Hydrocarbons Key project awards Key Improve awards and renewals Chevron - Rosebank front end CNOOC and Shell Petrochemicals engineering design (FEED), United Company Limited - site Improve Kingdom engineering service contract, China…
Minerals, Metals & Chemicals Key project awards Key Improve awards and renewals BASF - FEED for greenfield resin plant BHP Billiton Minera Escondida and NPG plant, China Improve contract, Chile Companhia Siderrgica Nacional - Tasnee -…
Infrastructure & Environment Key project awards Key Improve awards and renewals Anadarko Mozambique LNG - Master BP - Remediation Management Atlas integrated resource infrastructure Contract, Global planning, Mozambique BP -…
Power Key project awards Key Improve awards and renewals Polska Grupa Energetyczna - site Bruce Power - sustaining capital characterization and licensing / projects at nuclear facilities, Canada permitting services for the nuclear US…
Supplementary information to full year results 2013
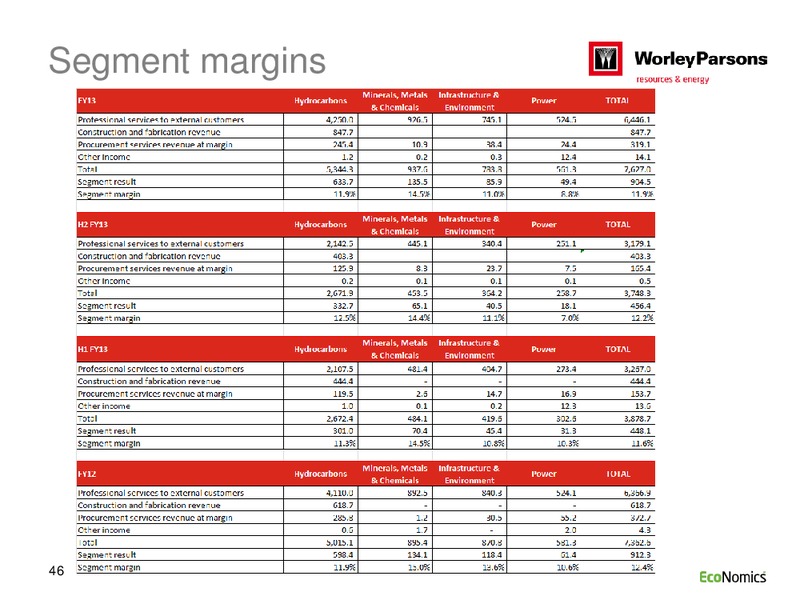
Segment margins 46
CSG restructure Aggregated Revenue EBIT Customer Project Var Var % Customer Project Var Var % Hydrocarbons 5,433.8 5,344.3 89.5 2% 648.9 633.7 15.2 2% Minerals, Metals & Chemicals 1,107.7 937.6 170.1 18% 153.9 135.5 18.4 14%…
Dividends, amortisation and tax Dividend History FY09 FY10 FY11* FY12* FY13 Interim dividend (cps) 38.0 35.5 36.0 40.0 41.5 Franked % 76% 100% 100% 79% 100% m total 92.2 87.0 88.6 98.3 102.4 Final dividend (cps) 55.0 40.0 50.0 51.0…
Contractual acronyms CY Calendar year EDS Engineering and Design Services E&P Engineering and Procurement EPC Engineering, Procurement and Construction EPCM Engineering, Procurement and Construction Management ESA Engineering Services…
 Loading...