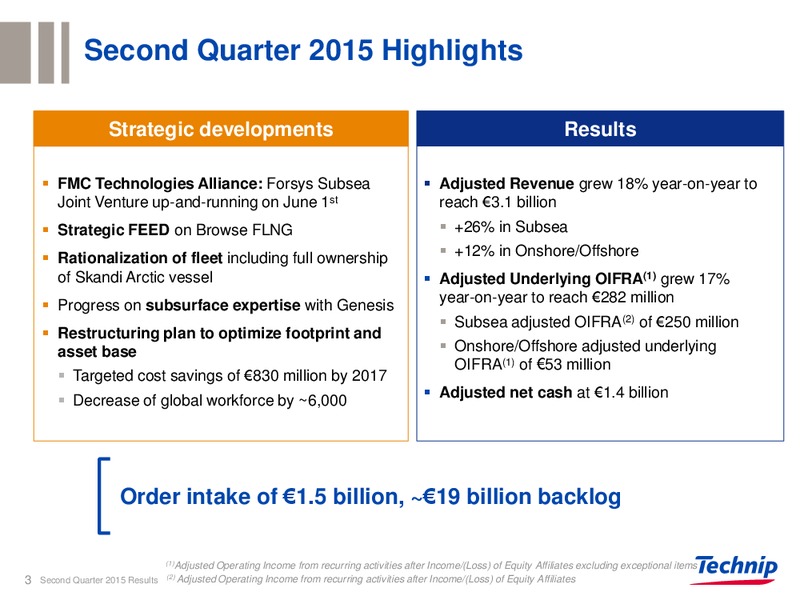
Second Quarter 2015 Highlights Strategic developments Results FMC Technologies Alliance: Forsys Subsea Adjusted Revenue grew 18% year-on-year to Joint Venture up-and-running on June 1st reach 3.1 billion Strategic FEED on Browse…
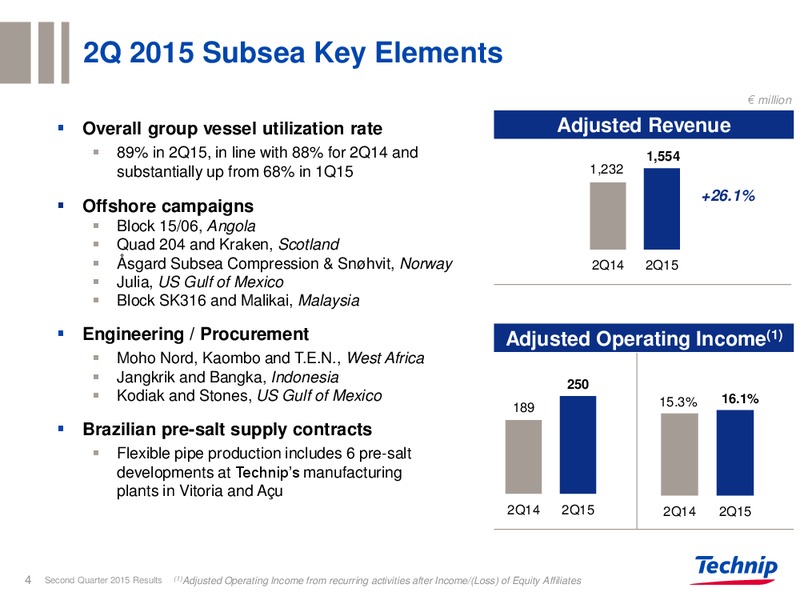
2Q 2015 Subsea Key Elements million Overall group vessel utilization rate Adjusted Revenue 89% in 2Q15, in line with 88% for 2Q14 and 1,554 substantially up from 68% in 1Q15 1,232 1,232 +26.1% Offshore campaigns Block 15/06,…
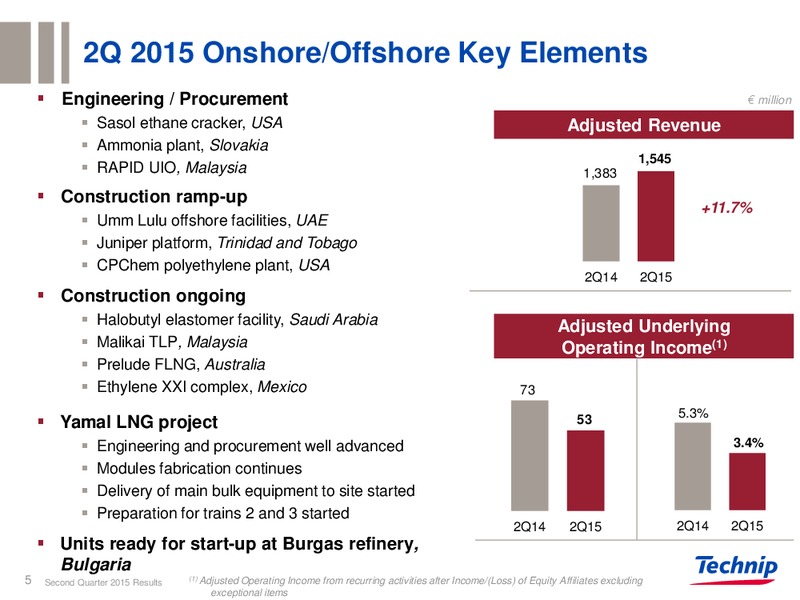
2Q 2015 Onshore/Offshore Key Elements Engineering / Procurement million Sasol ethane cracker, USA Adjusted Revenue Ammonia plant, Slovakia 1,545 RAPID UIO, Malaysia 1,383 Construction ramp-up +11.7% Umm Lulu offshore facilities,…
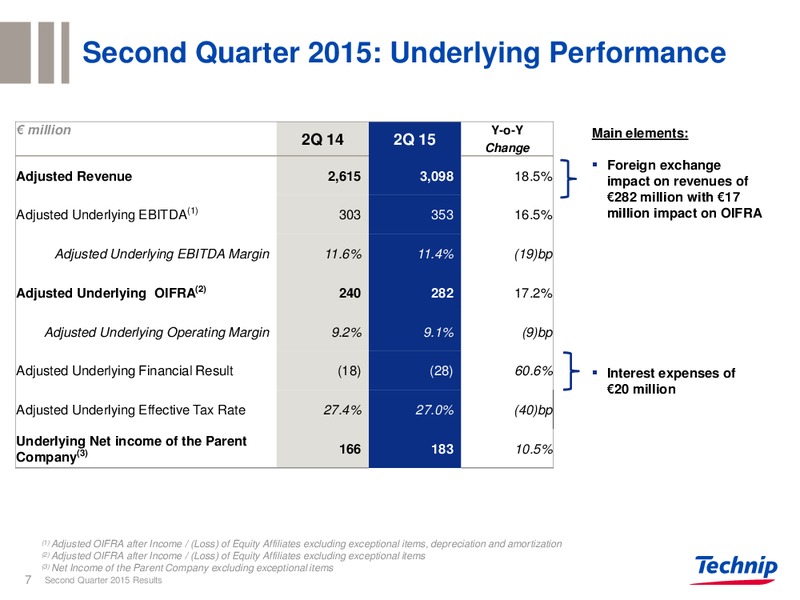
Second Quarter 2015: Underlying Performance million Y-o-Y Main elements: 2Q 14 2Q 15 Change Foreign exchange Adjusted Revenue 2,615 3,098 18.5% impact on revenues of 282 million with 17 Adjusted Underlying EBITDA(1) 303 353 16.5%…
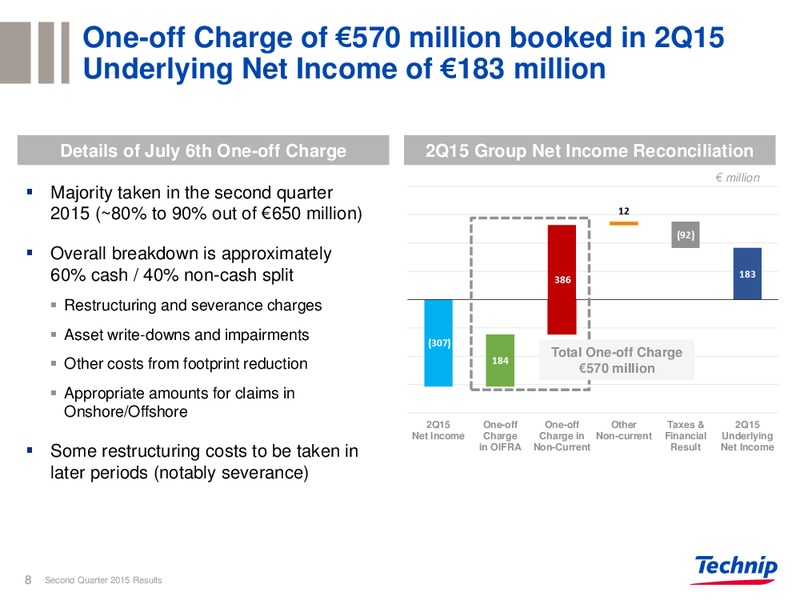
One-off Charge of 570 million booked in 2Q15 Underlying Net Income of 183 million Details of July 6th One-off Charge 2Q15 Group Net Income Reconciliation million Majority taken in the second quarter 2015 (80% to 90% out of 650…
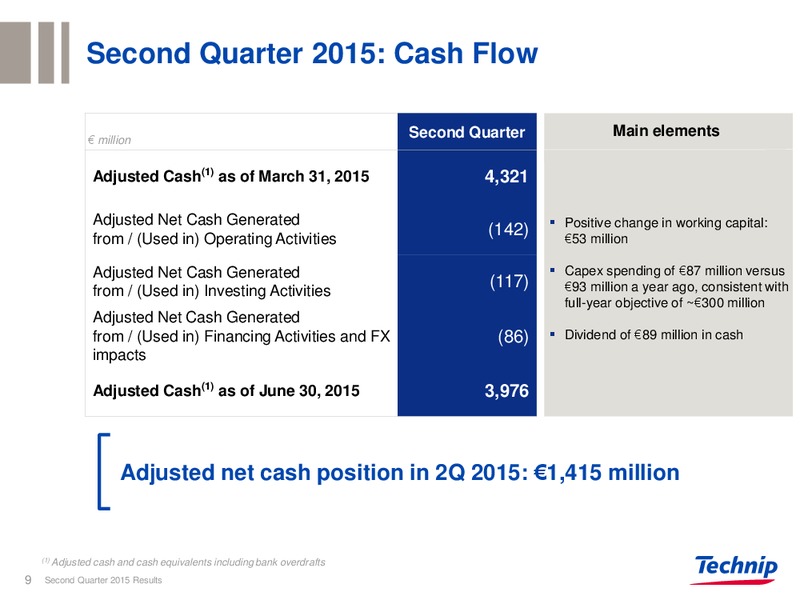
Second Quarter 2015: Cash Flow Main elements Second Quarter Main elements million Adjusted Cash(1) as of March 31, 2015 4,321 Adjusted Net Cash Generated Positive change in working capital: from / (Used in) Operating…
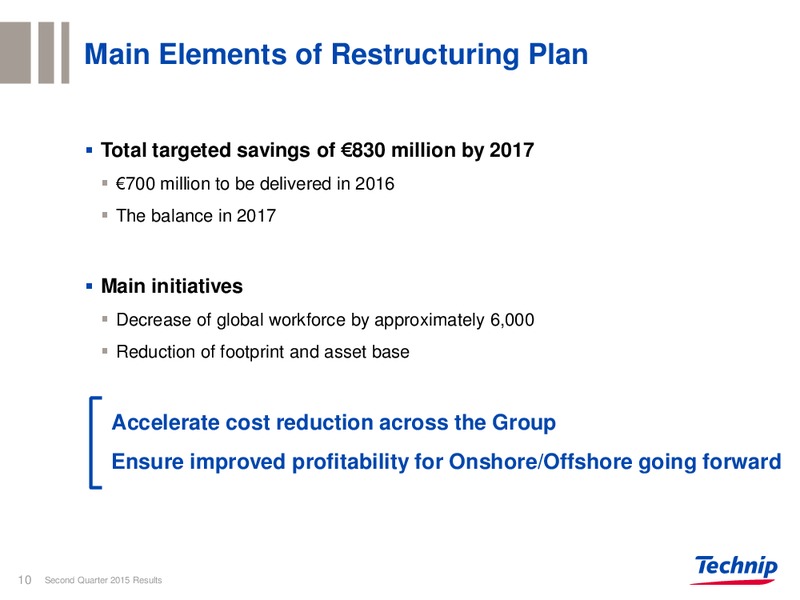
Main Elements of Restructuring Plan Total targeted savings of 830 million by 2017 700 million to be delivered in 2016 The balance in 2017 Main initiatives Decrease of global workforce by approximately 6,000 Reduction of…
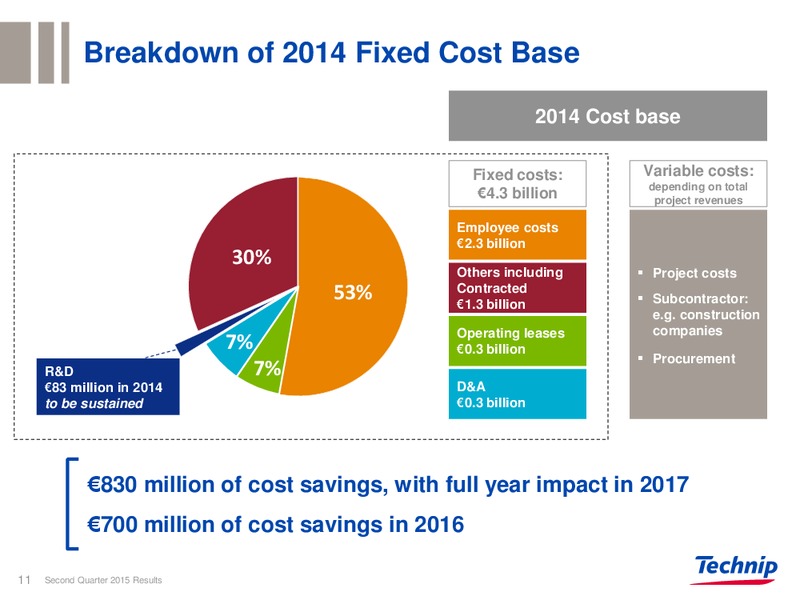
Breakdown of 2014 Fixed Cost Base 2014 Cost base Fixed costs: Variable costs: depending on total 4.3 billion project revenues Employee costs 2.3 billion 30% Others including Project costs 53% Contracted 1.3 billion…
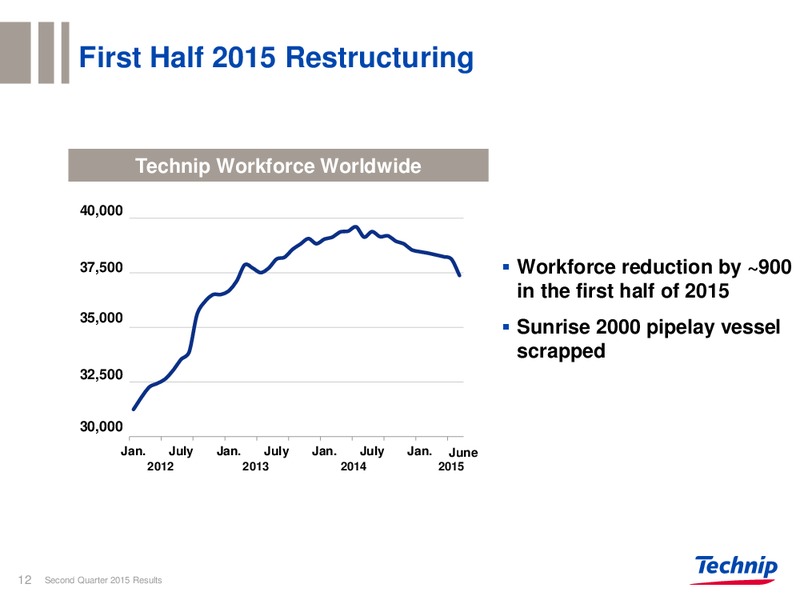
First Half 2015 Restructuring Technip Workforce Worldwide 40,000 40 000 37,500 37 500 Workforce reduction by 900 in the first half of 2015 35,000 35 000 Sunrise 2000 pipelay vessel scrapped 32,500 32 500 30,000 30…
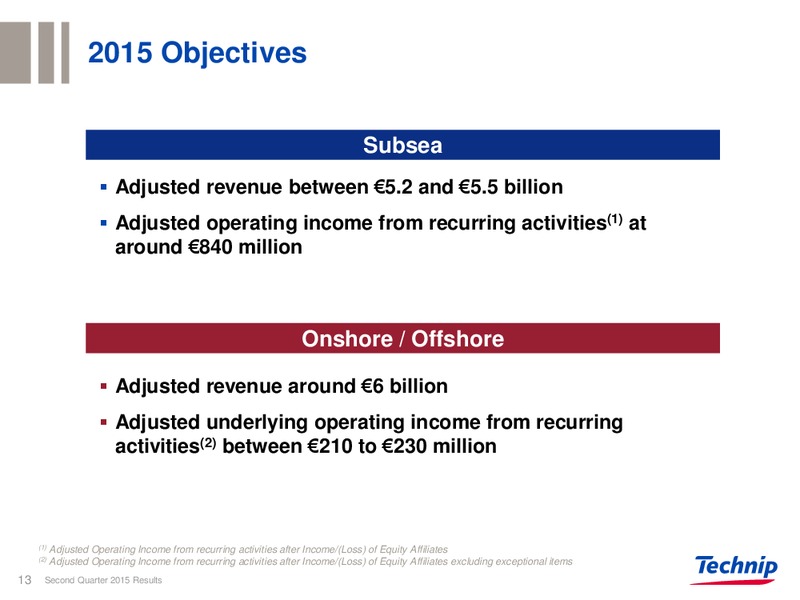
2015 Objectives Subsea Adjusted revenue between 5.2 and 5.5 billion Adjusted operating income from recurring activities(1) at around 840 million Onshore / Offshore Adjusted revenue around 6 billion Adjusted underlying…
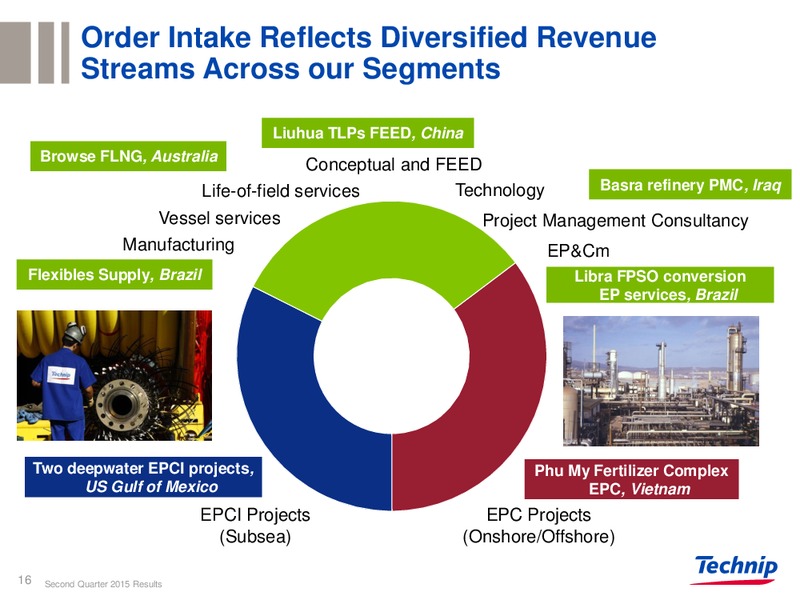
Order Intake Reflects Diversified Revenue Streams Across our Segments Liuhua TLPs FEED, China Browse FLNG, Australia Conceptual and FEED Life-of-field services Technology Basra refinery PMC, Iraq Vessel services Project…
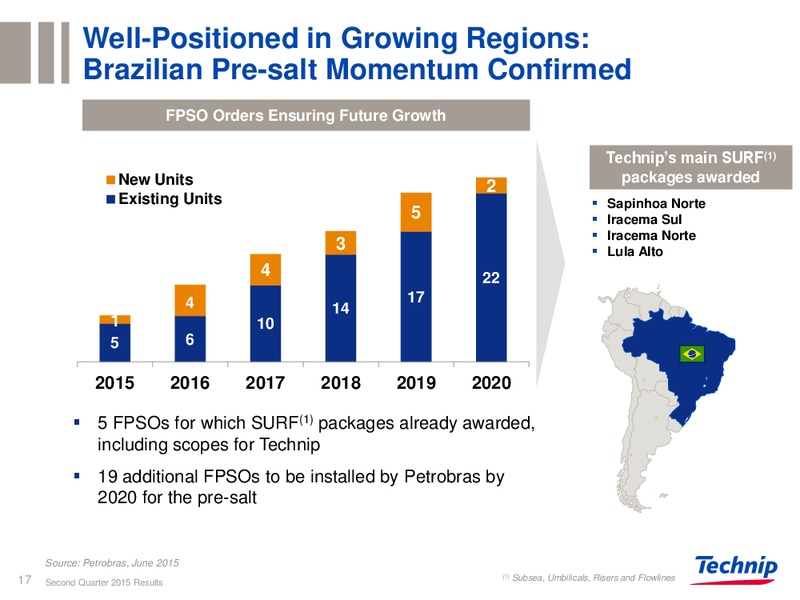
Well-Positioned in Growing Regions: Brazilian Pre-salt Momentum Confirmed FPSO Orders Ensuring Future Growth Technips main SURF(1) New Units packages awarded 2 Existing Units Sapinhoa Norte 5 Iracema Sul Iracema Norte 3 Lula…
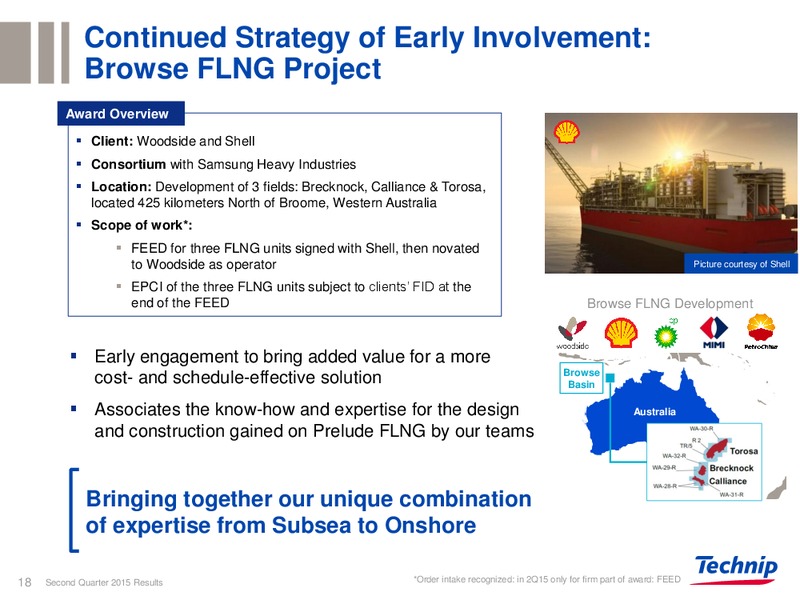
Continued Strategy of Early Involvement: Browse FLNG Project Award Overview Client: Woodside and Shell Consortium with Samsung Heavy Industries Location: Development of 3 fields: Brecknock, Calliance & Torosa, located 425…
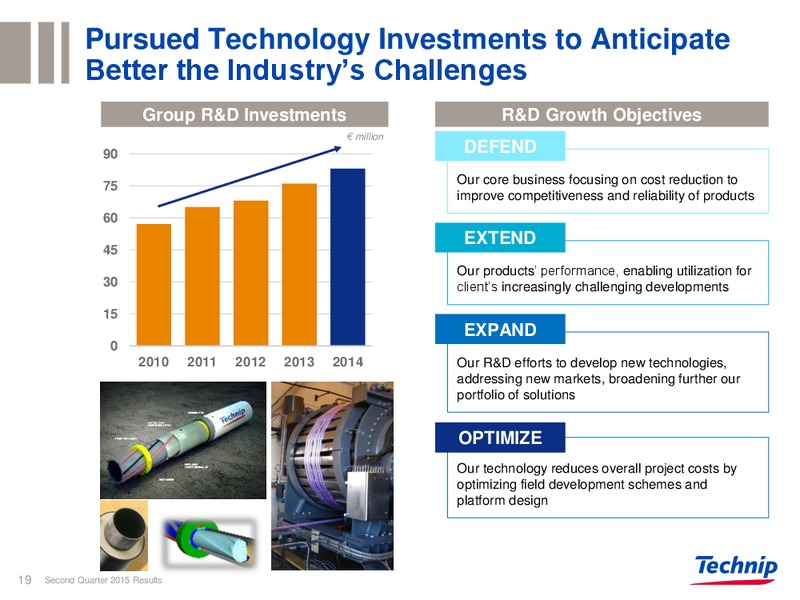
Pursued Technology Investments to Anticipate Better the Industrys Challenges Group R&D Investments R&D Growth Objectives million 90 DEFEND 75 Our core business focusing on cost reduction to improve competitiveness and reliability…
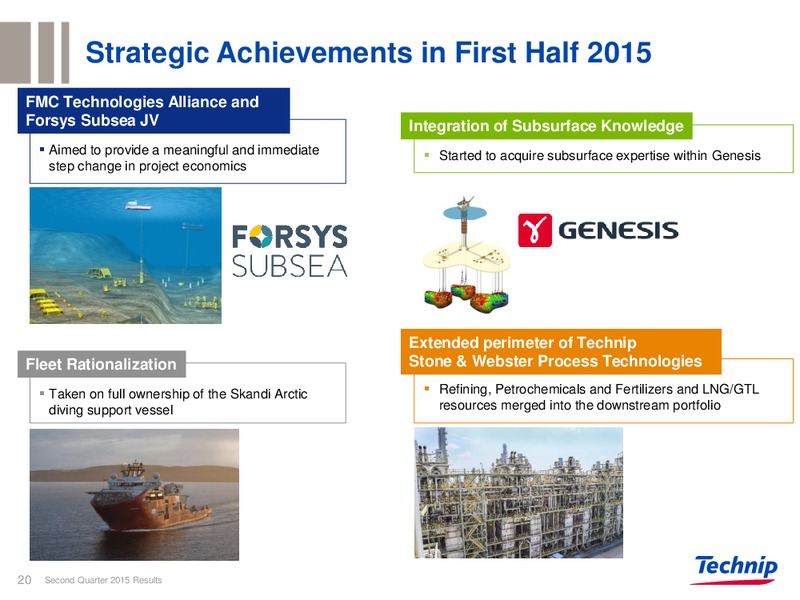
Strategic Achievements in First Half 2015 FMC Technologies Alliance and Forsys Subsea JV Integration of Subsurface Knowledge Aimed to provide a meaningful and immediate Started to acquire subsurface expertise within Genesis step…
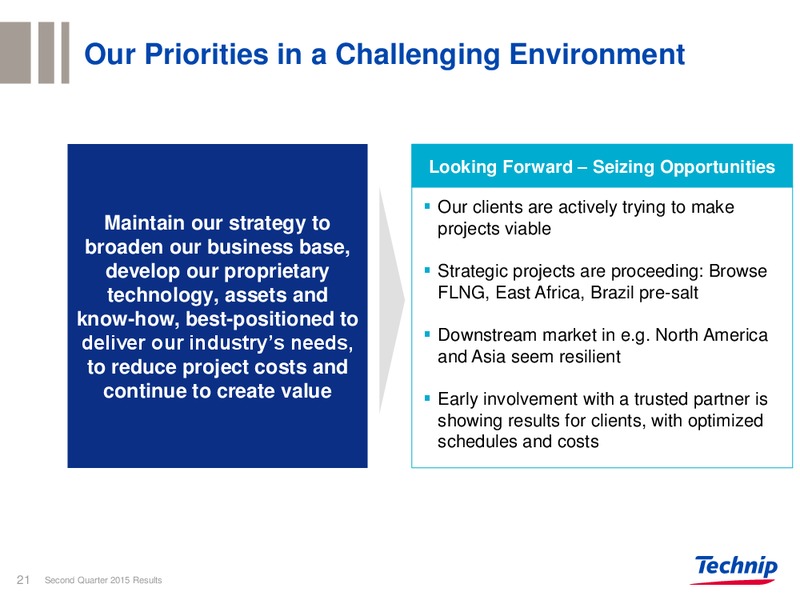
Our Priorities in a Challenging Environment Looking Forward Seizing Opportunities Our clients are actively trying to make Maintain our strategy to projects viable broaden our business base, develop our proprietary Strategic…
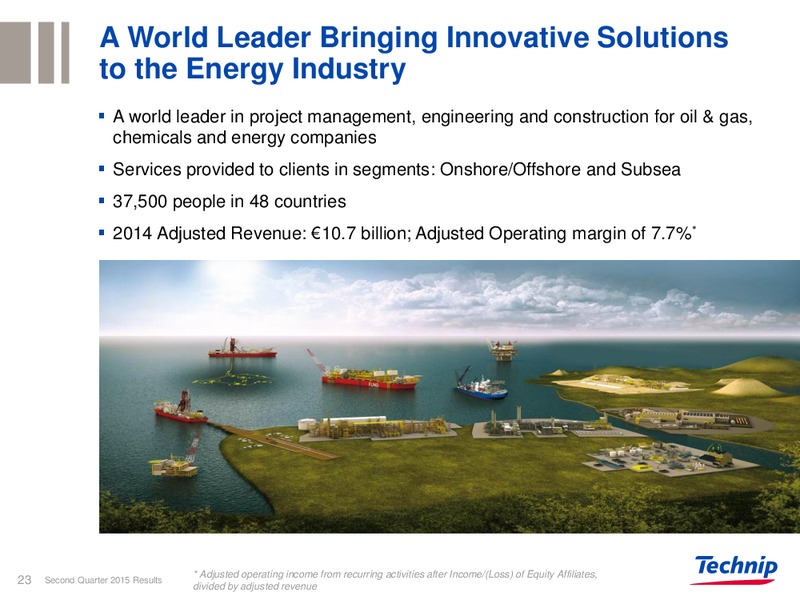
A World Leader Bringing Innovative Solutions to the Energy Industry A world leader in project management, engineering and construction for oil & gas, chemicals and energy companies Services provided to clients in segments:…
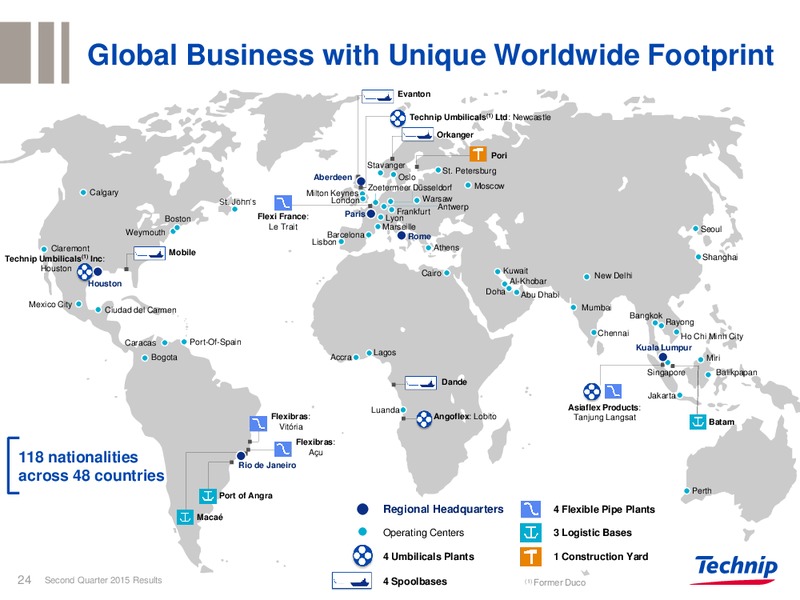
Global Business with Unique Worldwide Footprint Evanton Technip Umbilicals(1) Ltd: Newcastle Orkanger Pori Stavanger St. Petersburg Aberdeen Oslo Zoetermeer Dsseldorf Moscow Calgary Milton Keynes St. Johns London Warsaw…
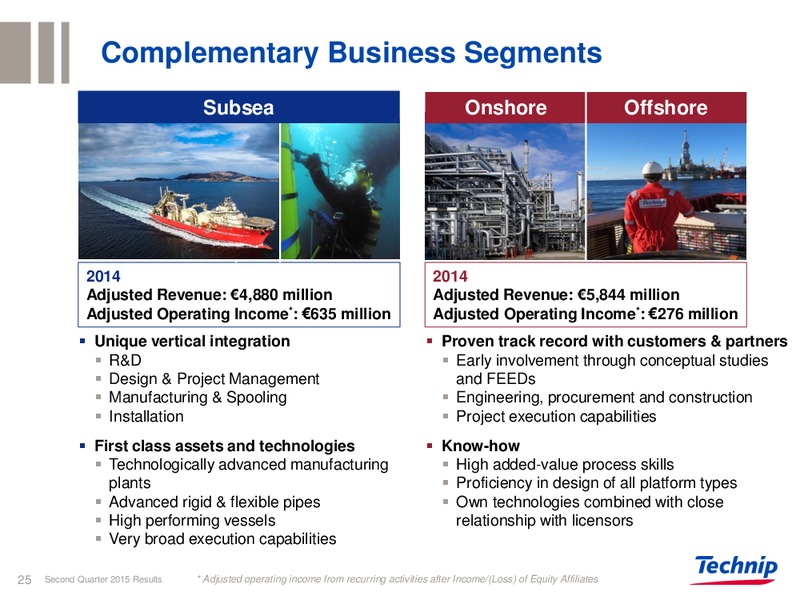
Complementary Business Segments Subsea Onshore Offshore 2014 2014 Adjusted Revenue: 4,880 million Adjusted Revenue: 5,844 million Adjusted Operating Income*: 635 million Adjusted Operating Income*: 276 million Unique vertical…
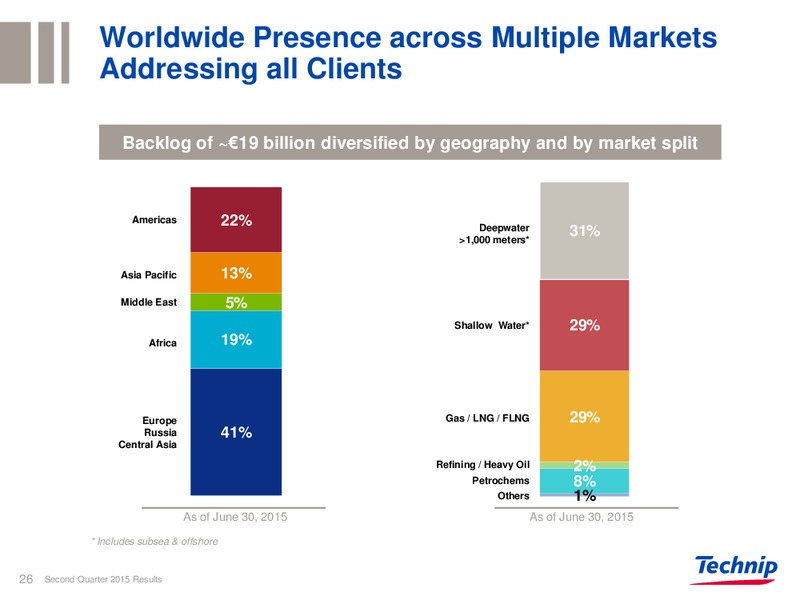
Worldwide Presence across Multiple Markets Addressing all Clients Backlog of 19 billion diversified by geography and by market split Americas 22% Deepwater 1,000 meters* 31% Asia Pacific 13% Middle East 5% Shallow Water*…
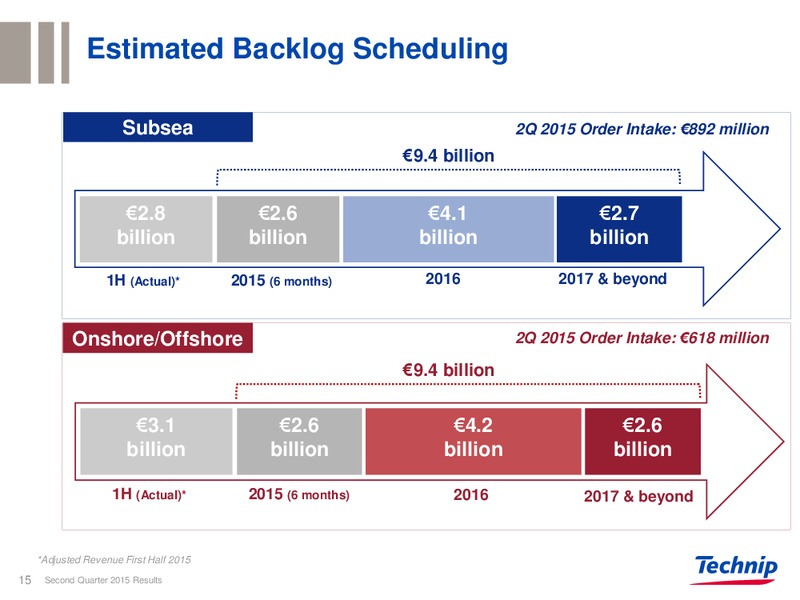
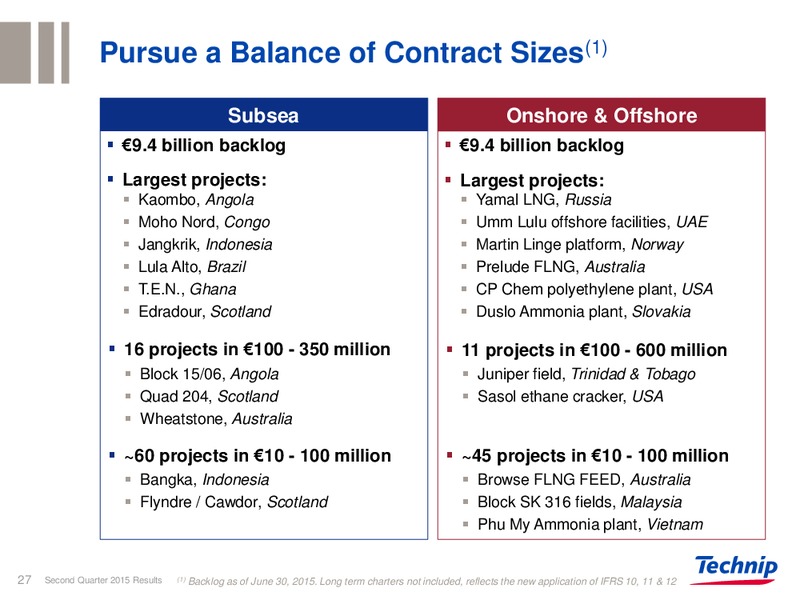
Pursue a Balance of Contract Sizes(1) Subsea Onshore & Offshore 9.4 billion backlog 9.4 billion backlog Largest projects: Largest projects: Kaombo, Angola Yamal LNG, Russia Moho Nord, Congo Umm Lulu offshore facilities, UAE…
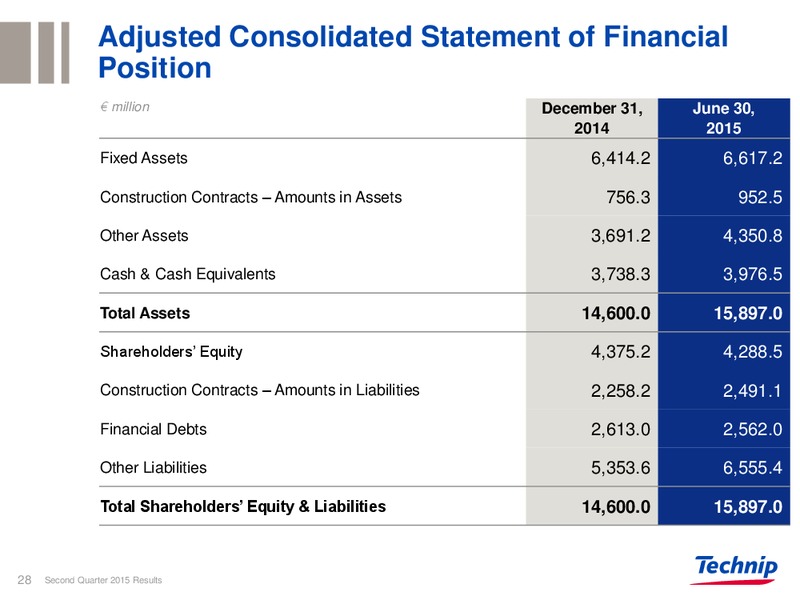
Adjusted Consolidated Statement of Financial Position million December 31, June 30, 2014 2015 Fixed Assets 6,414.2 6,617.2 Construction Contracts Amounts in Assets 756.3 952.5 Other Assets 3,691.2 4,350.8 Cash & Cash…
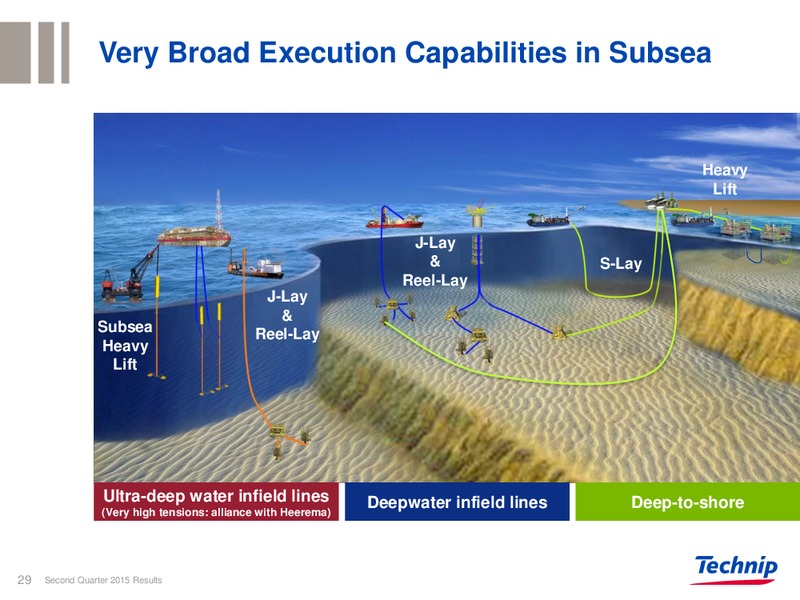
Very Broad Execution Capabilities in Subsea Heavy Lift J-Lay & S-Lay Reel-Lay J-Lay & Subsea Reel-Lay Heavy Lift Ultra-deep water infield lines Deepwater infield lines Deep-to-shore (Very high tensions: alliance with…
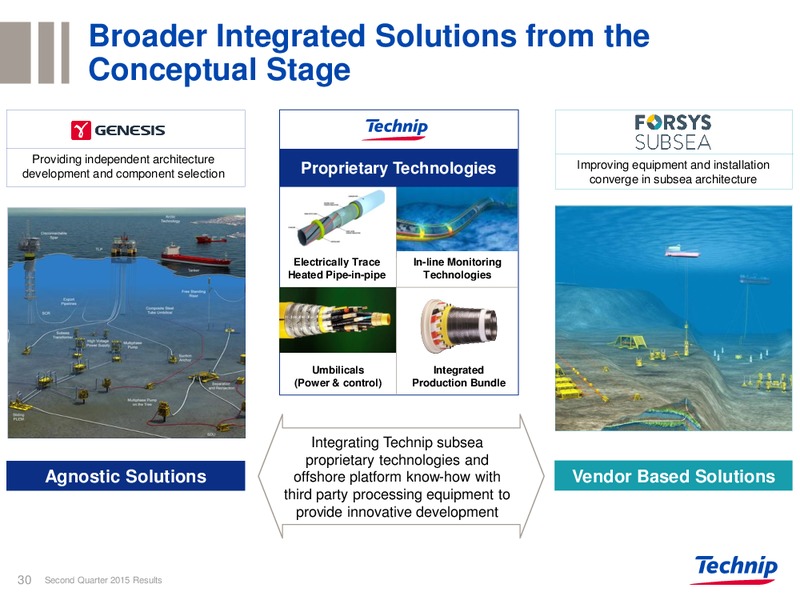
Broader Integrated Solutions from the Conceptual Stage Providing independent architecture Improving equipment and installation development and component selection Proprietary Technologies converge in subsea architecture…
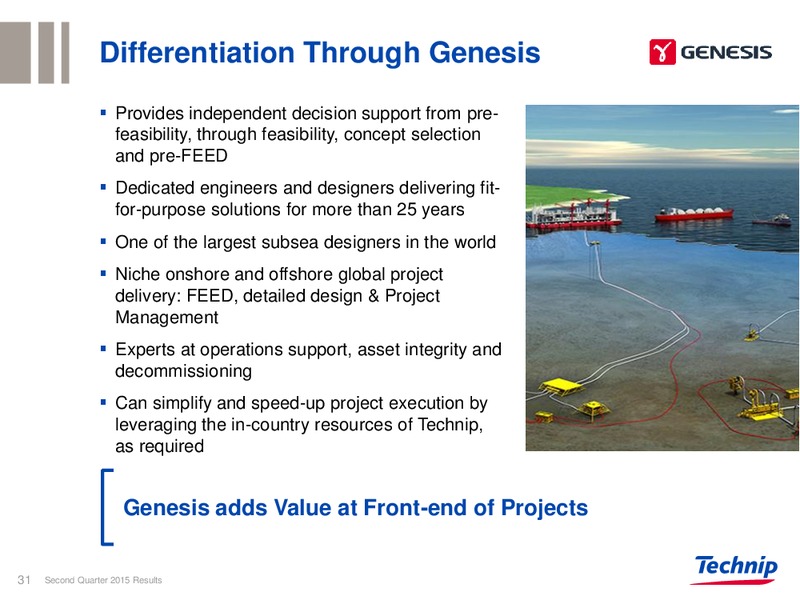
Differentiation Through Genesis Provides independent decision support from pre- feasibility, through feasibility, concept selection and pre-FEED Dedicated engineers and designers delivering fit- for-purpose solutions for more than…
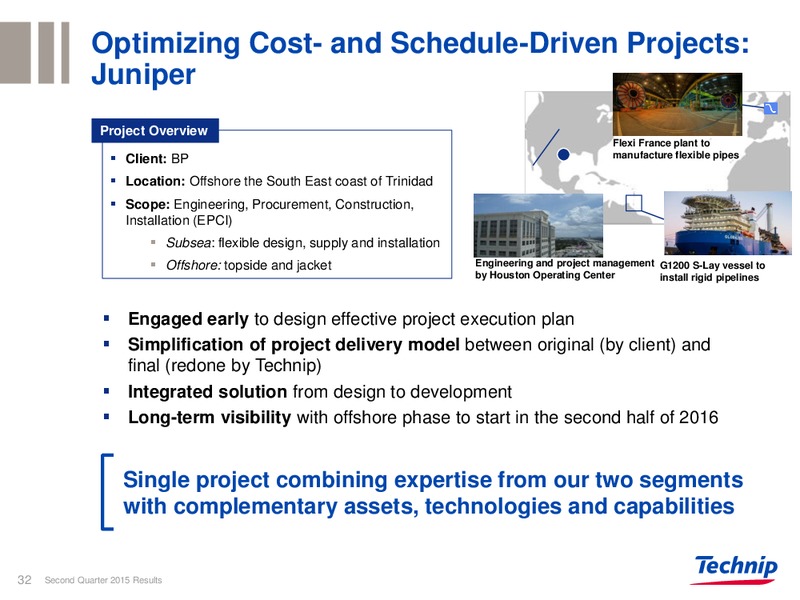
Optimizing Cost- and Schedule-Driven Projects: Juniper Project Overview Flexi France plant to manufacture flexible pipes Client: BP Location: Offshore the South East coast of Trinidad Scope: Engineering, Procurement,…
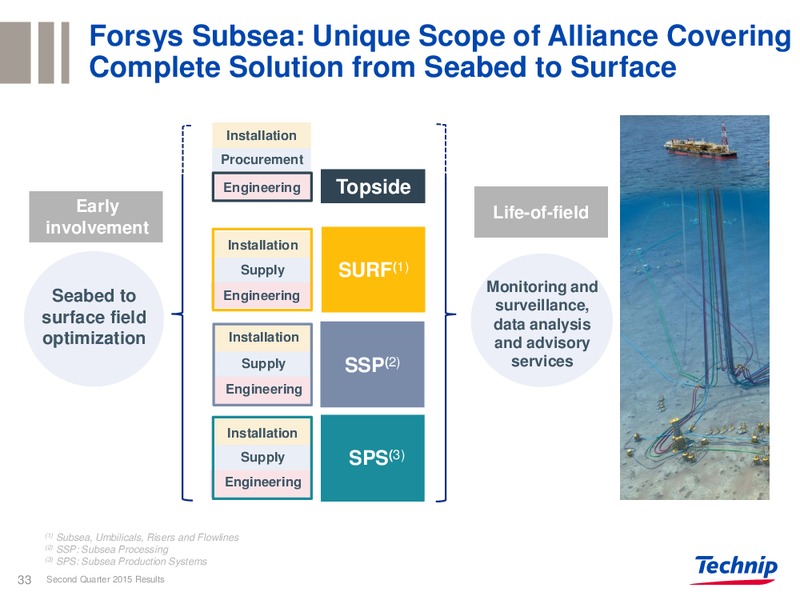
Forsys Subsea: Unique Scope of Alliance Covering Complete Solution from Seabed to Surface Installation Procurement Engineering Topside Early Life-of-field involvement Installation Supply SURF(1) Monitoring and Seabed to…
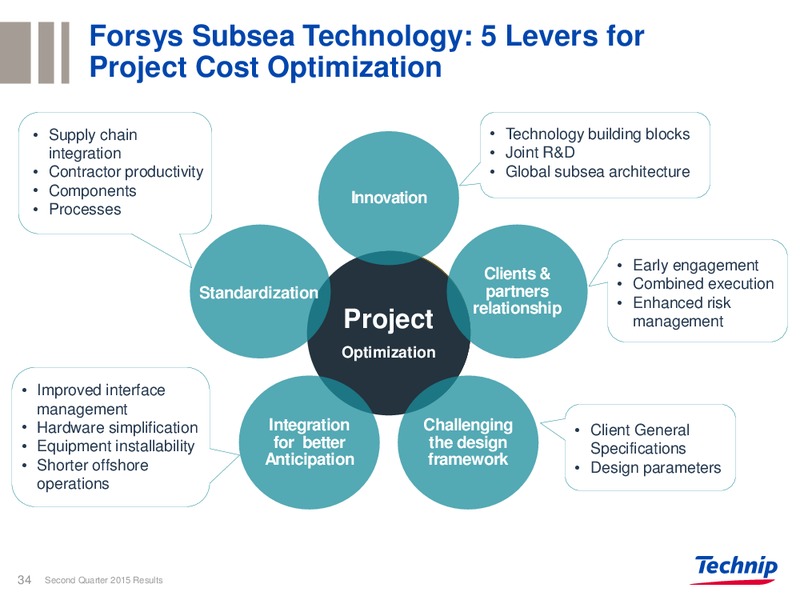
Forsys Subsea Technology: 5 Levers for Project Cost Optimization Supply chain Technology building blocks integration Joint R&D Contractor productivity Global subsea architecture Components Innovation Processes Early engagement…
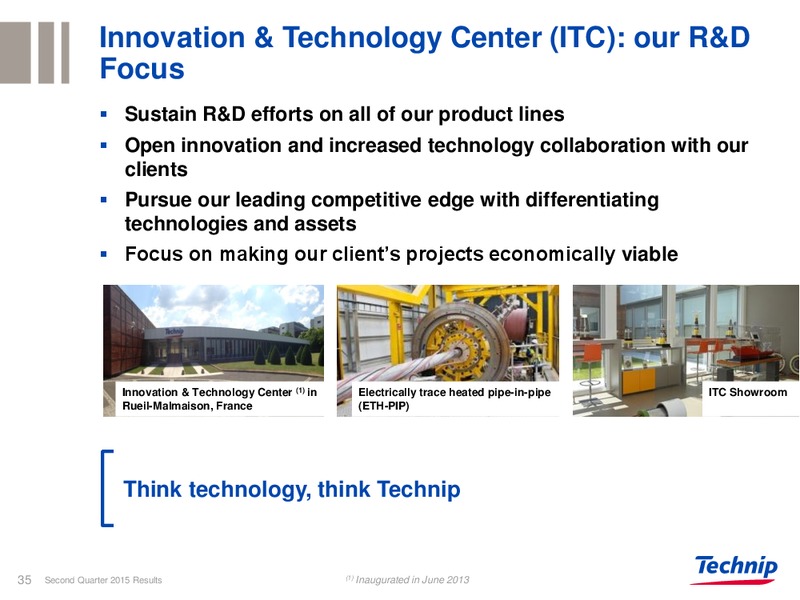
Innovation & Technology Center (ITC): our R&D Focus Sustain R&D efforts on all of our product lines Open innovation and increased technology collaboration with our clients Pursue our leading competitive edge with differentiating…
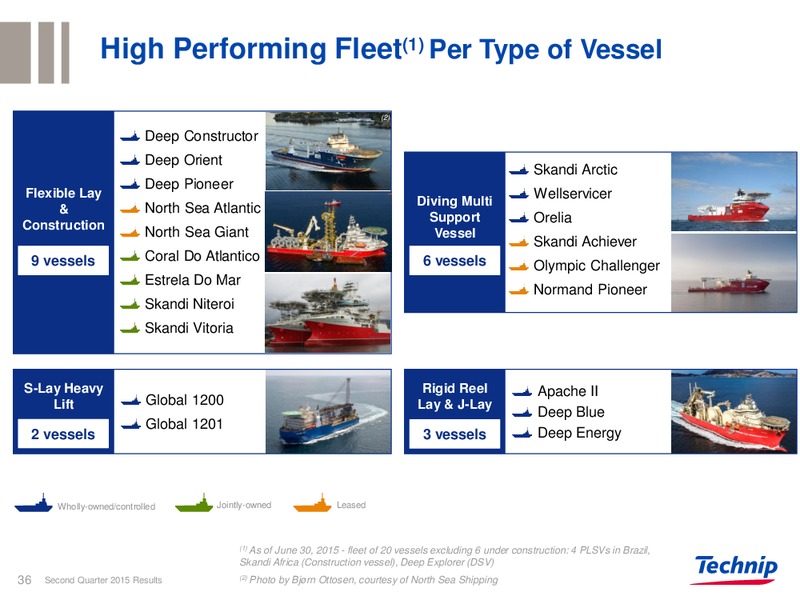
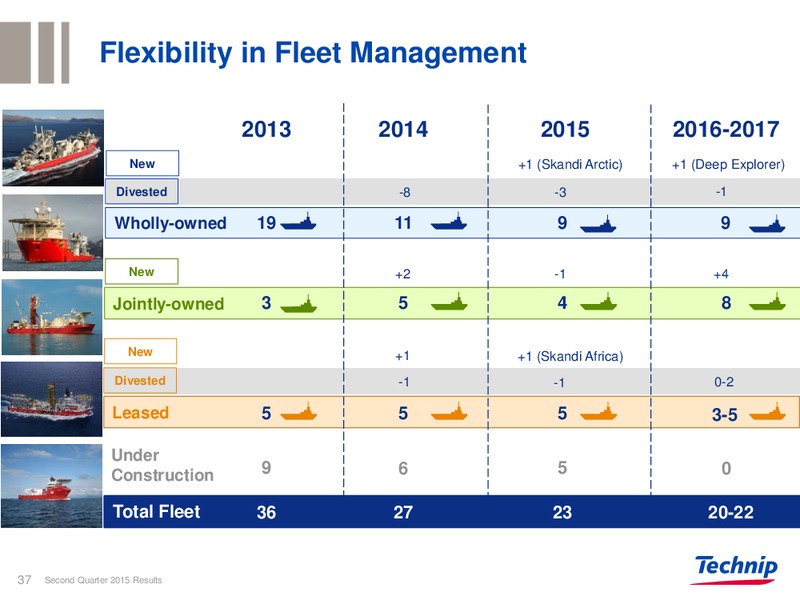
High Performing Fleet(1) Per Type of Vessel (2) Deep Constructor Deep Orient Skandi Arctic Deep Pioneer Flexible Lay Wellservicer Diving Multi & North Sea Atlantic Support Orelia Construction North Sea Giant Vessel Skandi…
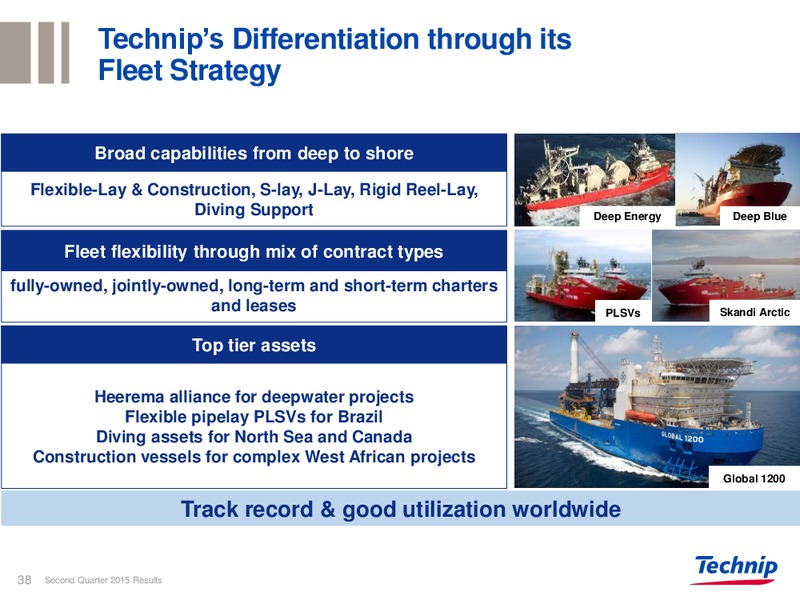
Technips Differentiation through its Fleet Strategy Broad capabilities from deep to shore Flexible-Lay & Construction, S-lay, J-Lay, Rigid Reel-Lay, Diving Support Deep Energy Deep Blue Fleet flexibility through mix of contract…
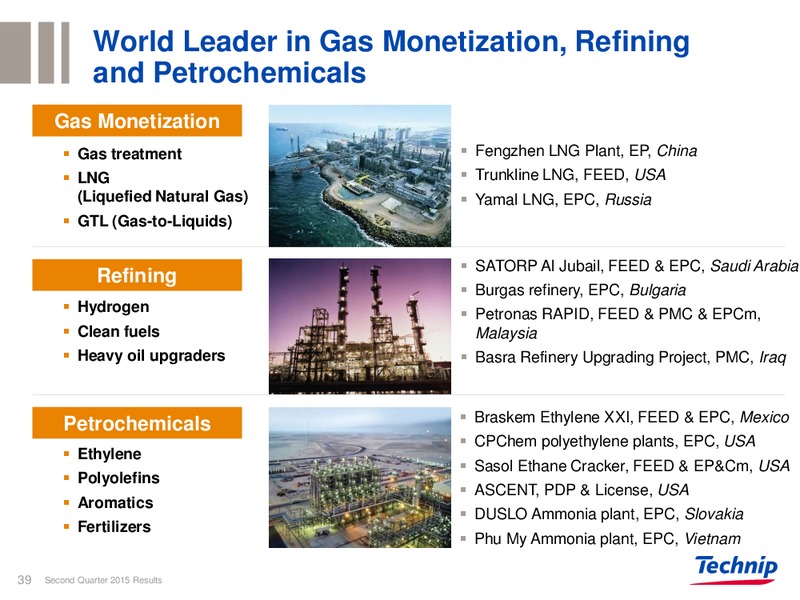
World Leader in Gas Monetization, Refining and Petrochemicals Gas Monetization Gas treatment Fengzhen LNG Plant, EP, China LNG Trunkline LNG, FEED, USA (Liquefied Natural Gas) Yamal LNG, EPC, Russia GTL (Gas-to-Liquids) SATORP Al…
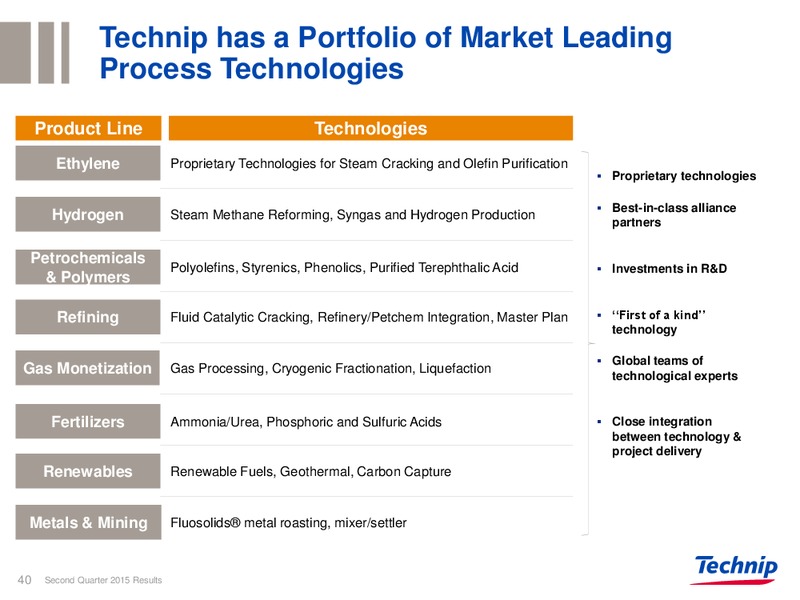
Technip has a Portfolio of Market Leading Process Technologies Product Line Technologies Ethylene Proprietary Technologies for Steam Cracking and Olefin Purification Proprietary technologies Best-in-class alliance Hydrogen Steam…
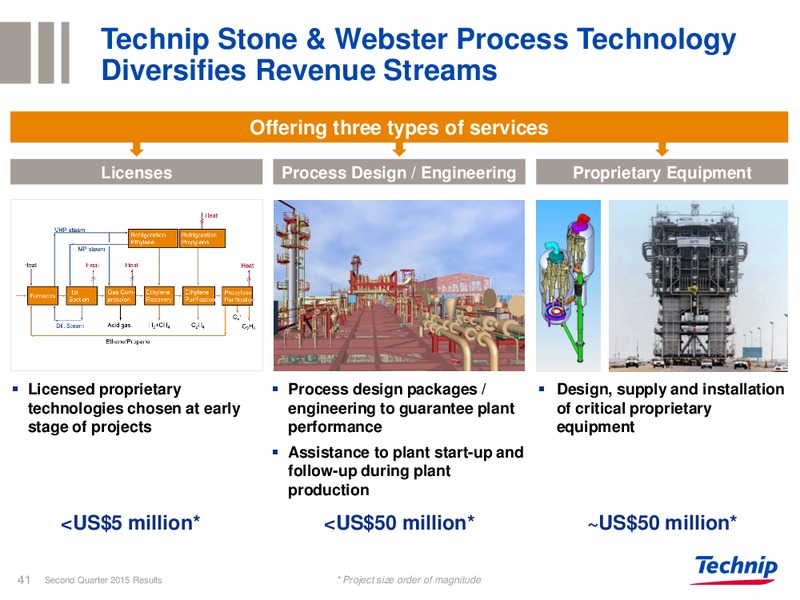
Technip Stone & Webster Process Technology Diversifies Revenue Streams Offering three types of services Licenses Process Design / Engineering Proprietary Equipment Licensed proprietary Process design packages / Design, supply…
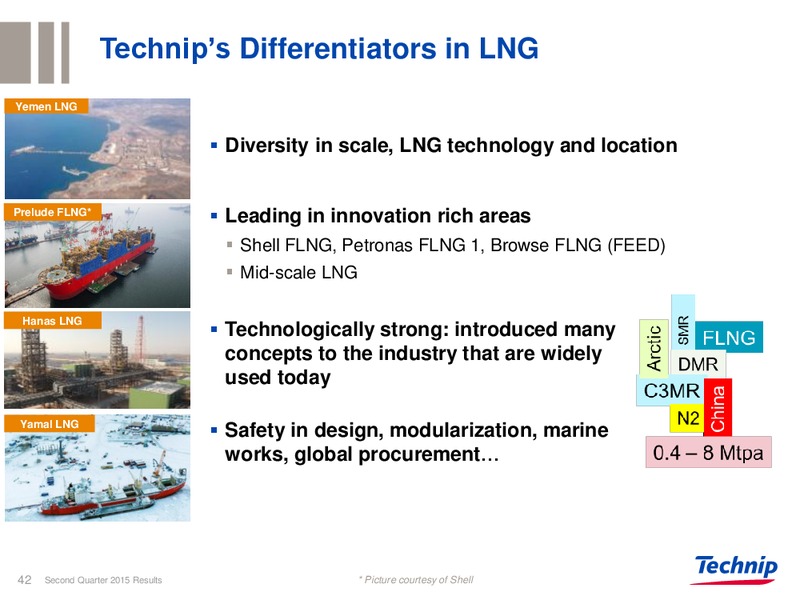
Technips Differentiators in LNG Yemen LNG Diversity in scale, LNG technology and location Prelude FLNG* Leading in innovation rich areas Shell FLNG, Petronas FLNG 1, Browse FLNG (FEED) Mid-scale LNG Hanas LNG Technologically…
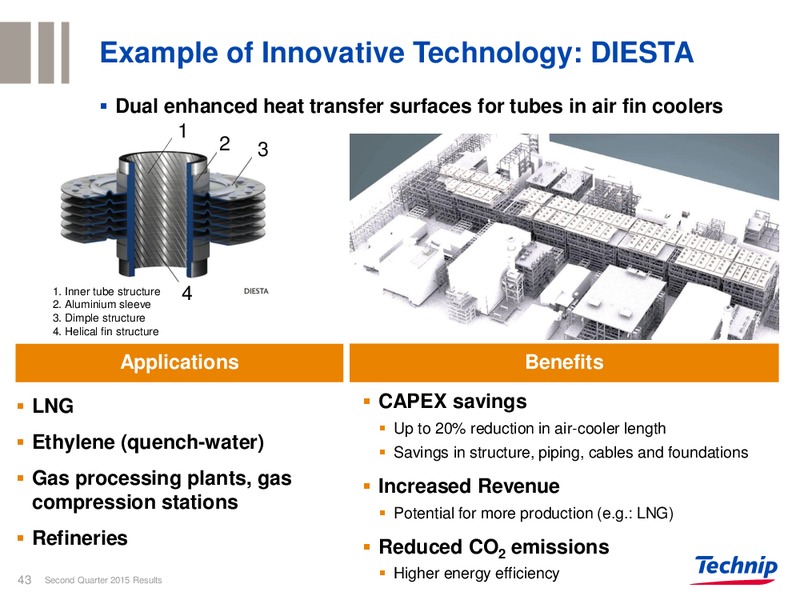
Example of Innovative Technology: DIESTA Dual enhanced heat transfer surfaces for tubes in air fin coolers 1 2 3 1. Inner tube structure 2. Aluminium sleeve 4 3. Dimple structure 4. Helical fin structure Applications…
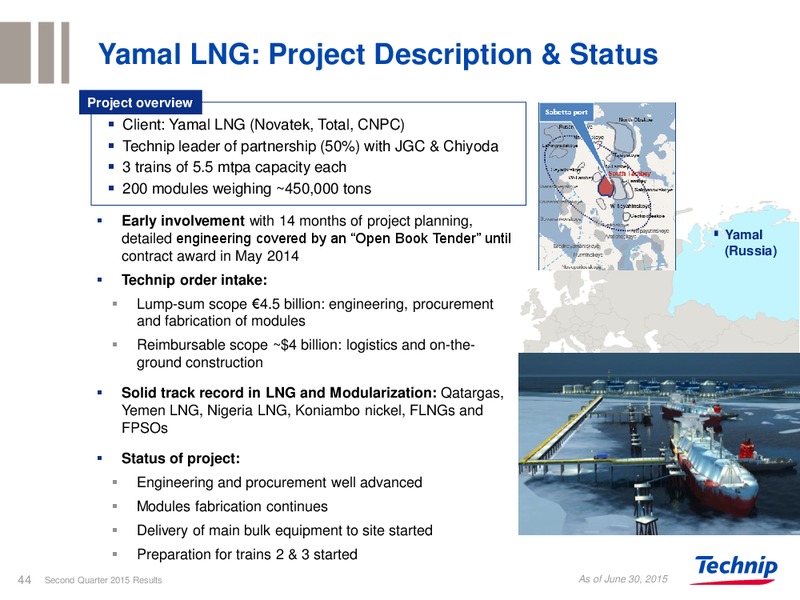
Yamal LNG: Project Description & Status Project overview Client: Yamal LNG (Novatek, Total, CNPC) Technip leader of partnership (50%) with JGC & Chiyoda 3 trains of 5.5 mtpa capacity each 200 modules weighing 450,000 tons Early…
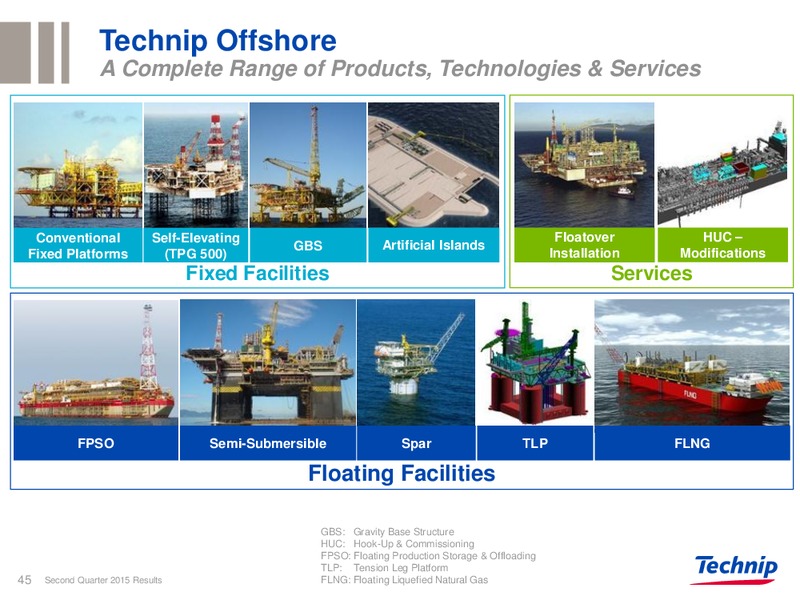
Technip Offshore A Complete Range of Products, Technologies & Services Conventional Self-Elevating Floatover HUC GBS Artificial Islands Fixed Platforms (TPG 500) Installation Modifications Fixed Facilities Services FPSO…
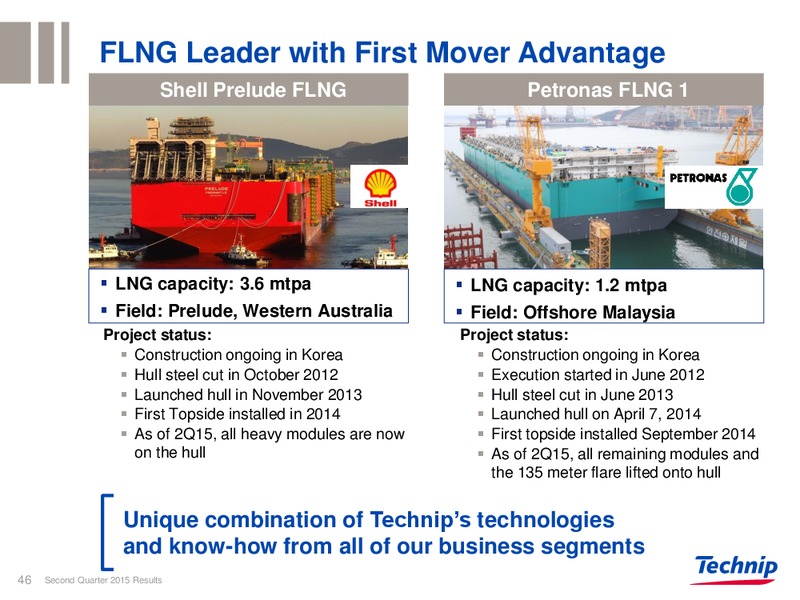
FLNG Leader with First Mover Advantage Shell Prelude FLNG Petronas FLNG 1 LNG capacity: 3.6 mtpa LNG capacity: 1.2 mtpa Field: Prelude, Western Australia Field: Offshore Malaysia Project status: Project status: Construction…
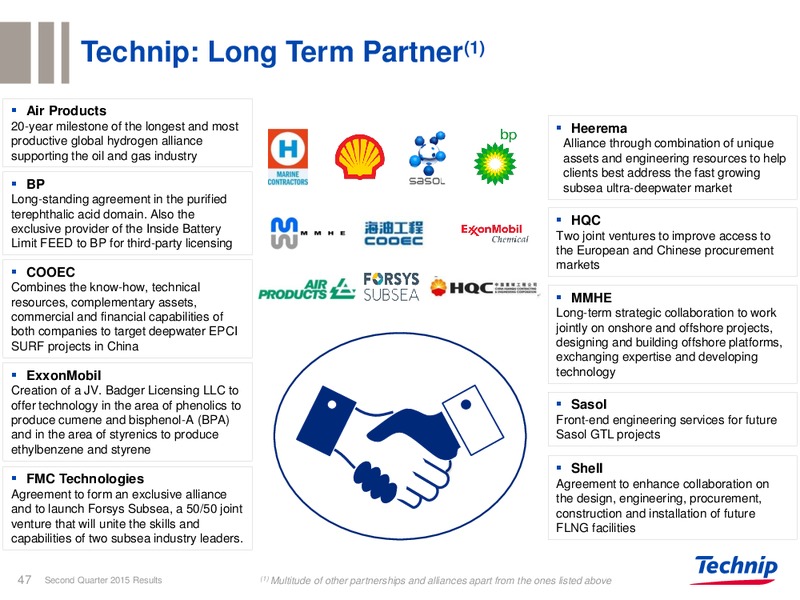
Technip: Long Term Partner(1) Air Products 20-year milestone of the longest and most Heerema productive global hydrogen alliance Alliance through combination of unique supporting the oil and gas industry assets and engineering resources…
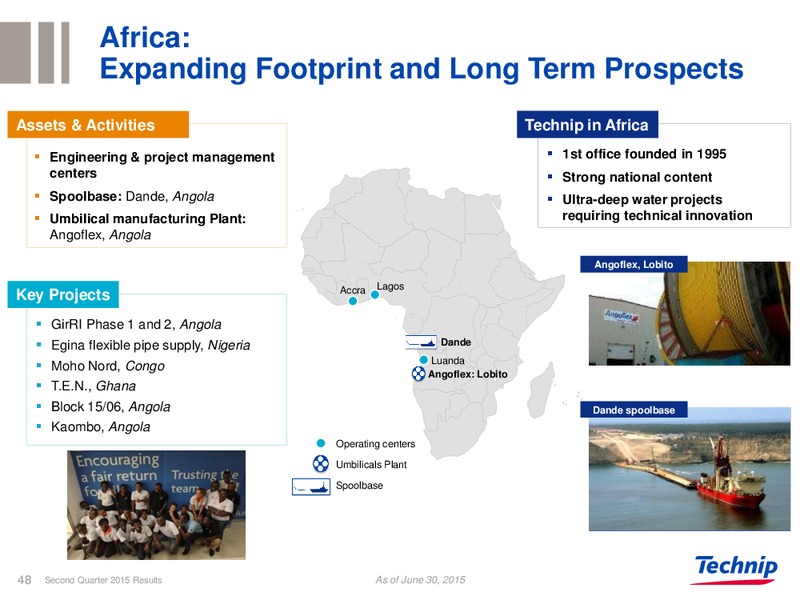
Africa: Expanding Footprint and Long Term Prospects Assets & Activities Technip in Africa Engineering & project management 1st office founded in 1995 centers Strong national content Spoolbase: Dande, Angola Ultra-deep water…
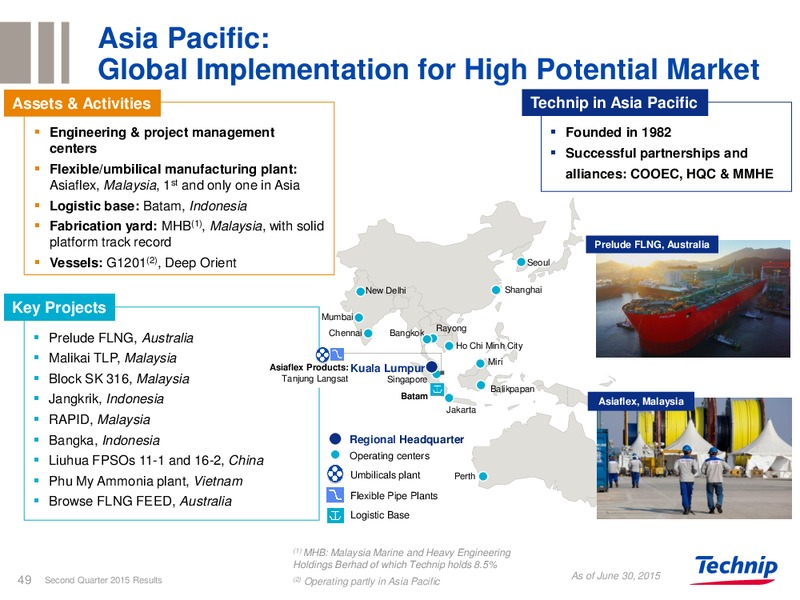
Asia Pacific: Global Implementation for High Potential Market Assets & Activities Technip in Asia Pacific Engineering & project management Founded in 1982 centers Successful partnerships and Flexible/umbilical manufacturing plant:…
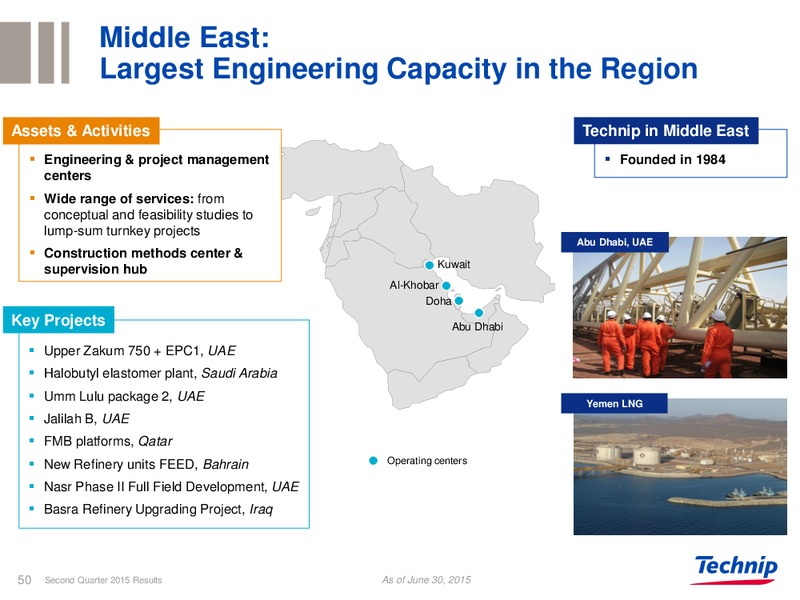
Middle East: Largest Engineering Capacity in the Region Assets & Activities Technip in Middle East Engineering & project management Founded in 1984 centers Wide range of services: from conceptual and feasibility studies to…
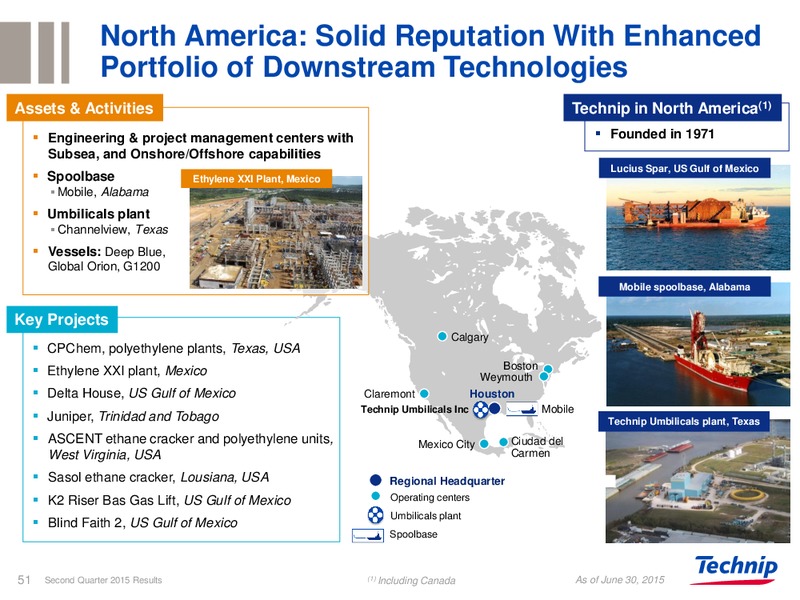
North America: Solid Reputation With Enhanced Portfolio of Downstream Technologies Assets & Activities Technip in North America(1) Engineering & project management centers with Founded in 1971 Subsea, and Onshore/Offshore…
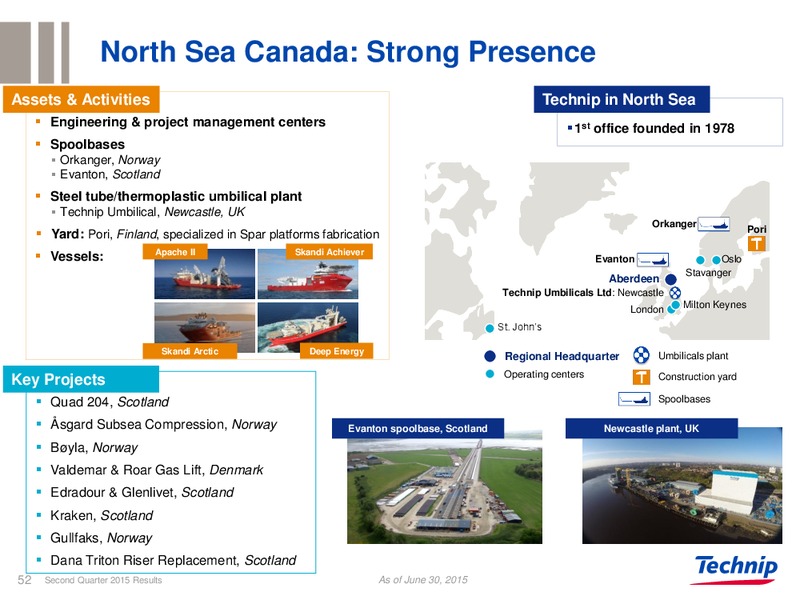
North Sea Canada: Strong Presence Assets & Activities Technip in North Sea Engineering & project management centers 1st office founded in 1978 Spoolbases Orkanger, Norway Evanton, Scotland Steel tube/thermoplastic umbilical plant…
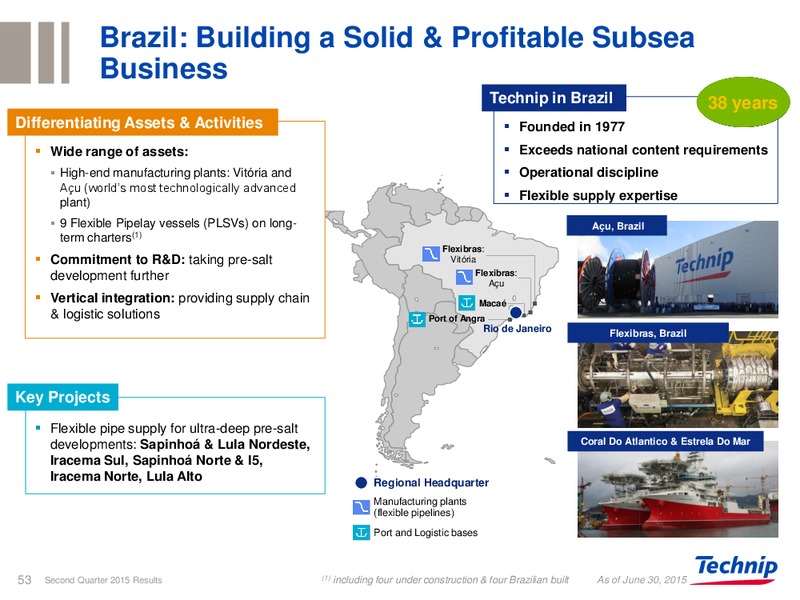
Brazil: Building a Solid & Profitable Subsea Business Technip in Brazil 38 years Differentiating Assets & Activities Founded in 1977 Wide range of assets: Exceeds national content requirements High-end manufacturing plants: Vitria…
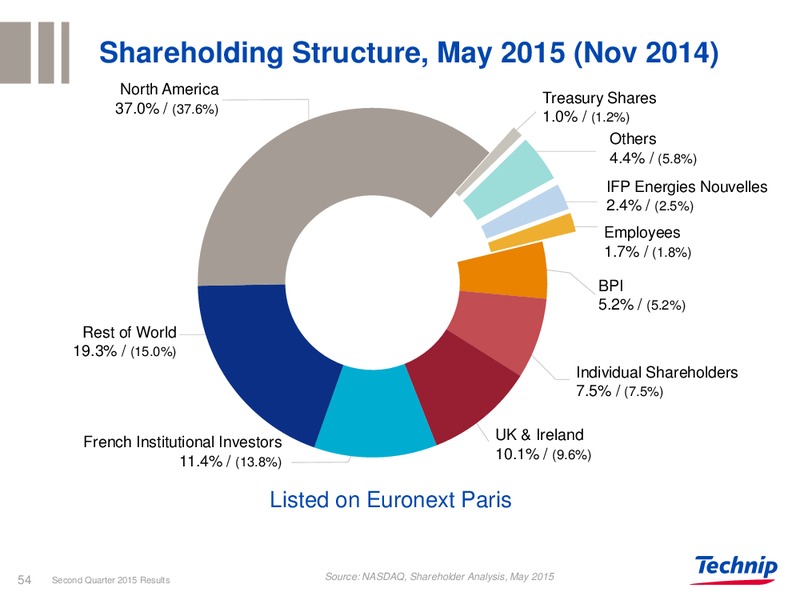
Shareholding Structure, May 2015 (Nov 2014) North America Treasury Shares 37.0% / (37.6%) 1.0% / (1.2%) Others 4.4% / (5.8%) IFP Energies Nouvelles 2.4% / (2.5%) Employees 1.7% / (1.8%) BPI 5.2% / (5.2%) Rest of World…
 Loading...