Agenda 1 Developments during the quarter 2 Project Activity Anchoring Ropes and Valves 3 Firm Orders (backlog) 4 Net Revenues 5 Net Revenues by Business Unit 6 Gross Profit 7 Expenses 8 EBITDA 9 Working Capital 10 Operational…
Developments during the quarter Several actions underway, and until conclusion expected by the end of 2012, we will see alternate periods of relevant and modest progress, in different areas of the Company. The focus is…
Projects Activity Anchoring Ropes and Valves Intense activity in projects of oil and gas production platforms and refineries, benefiting the anchoring ropes and valves businesses Project Valves Anchoring Ropes Expectation - closing…
Firm Orders (Backlog) Backlog presented a decrease of 2% in the quarter, mainly in the O&G services and anchoring ropes. This decrease was compensated by the growth in orders of valves Breakdown - Tenor Backlog Trend 306 2,535…
Net Revenues Decrease of revenues in compressors, O&G valves and O&G services impacted the 3Q11 Net Revenues, which decreased 2% compared to the 2Q11. In the 9M comparison there was a 8% growth due mainly to the anchoring ropes and…
Net Revenues by Business Unit Decrease of revenues in compressors, O&G Valves and O&G services impacted the Net Revenues of the 3Q11. Delays in inspection and shipping were the main reasons Breakdown of Net Revenues (variation and %…
Gross Profit Product mix with lower value added in O&G valves and industrial valves, in Brazil and Argentina, impacted the Gross Profit, which was compensated by price readjustments in the Metallurgy segment. In the 9M comparison,…
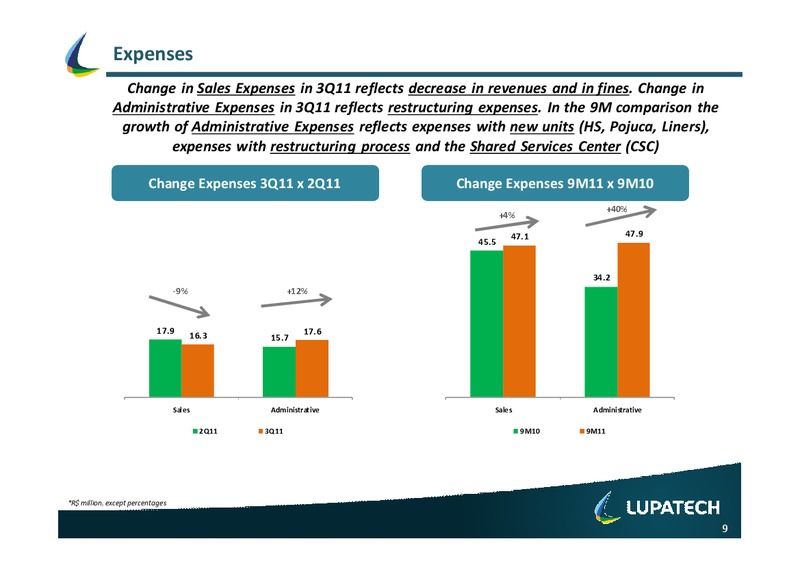
Expenses Change in Sales Expenses in 3Q11 reflects decrease in revenues and in fines. Change in Administrative Expenses in 3Q11 reflects restructuring expenses. In the 9M comparison the growth of Administrative Expenses reflects…
EBITDA Loss of Gross Margin in the Energy Products segment resulted in decrease of 28% in the 3Q11 EBITDA. In the 9M comparison there was a 26% growth due to mainly the gain of gross margin of the Energy Products segment EBITDA 3Q11…
Working Capital x Revenue Growth Despite the Net Revenues of the last 4 quarters have been higher that in the 2Q11, there was growth of working capital applied to the businesses due to mainly growth in Accounts Receivable in valves…
Operational Cash Flow During the 3Q11 there was operational cash flow generation of R1.6 million, which represented 0.1x the EBITDA of the quarter. In the 12M comparison, there was consumption of operational cash flow due to working…
Indebtedness Change in the Indebtedness in the 3Q11 is due to essentially the exchange variance expense (non cash) that impacted mainly the balance of the Perpetual Bonds, and consequently the Net Result of the Company Change in…
Questions and Answers Q&A 14
IR Contacts Alexandre Monteiro Cynthia Burin CEO & IRO IR Manager irlupatech.com.br www.lupatech.com.br/ir Telephone: +55 (11) 2134-7000 Follow Lupatech on www.twitter.com/LUPA3 (Portuguese) www.twitter.com/LupatechSA (English)
 Loading...