CEO Remarks Strong progress on Penn Wests long-term strategy in the quarter Delivered Q2 production within guidance - 91,164 boe/d (69% liquids) Finalized amending agreements with our lenders Reduced net debt by 500MM At June…
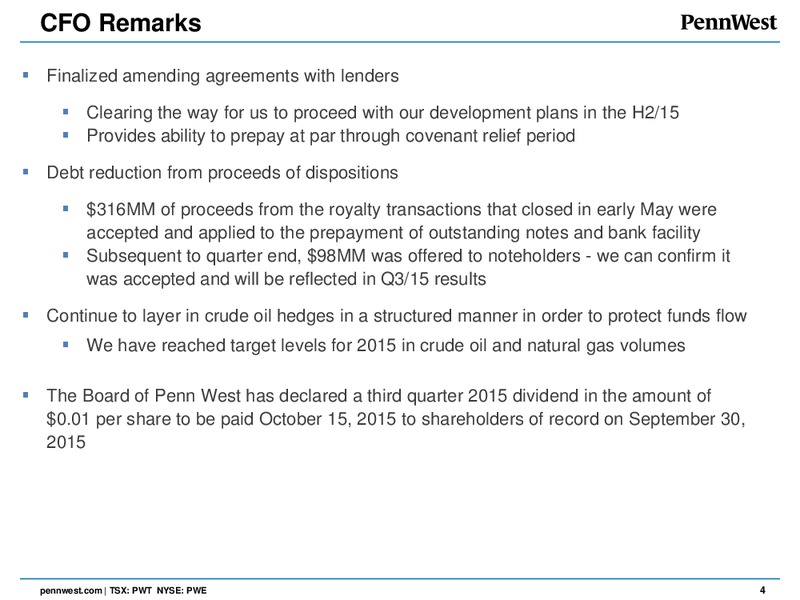
CFO Remarks Finalized amending agreements with lenders Clearing the way for us to proceed with our development plans in the H2/15 Provides ability to prepay at par through covenant relief period Debt reduction from proceeds of…
Net Debt Bridge As of June 30, 2015, the Company is in compliance with all financial covenants and had 700MM of undrawn capacity on its 1.2B bank facility Net debt was reduced by 500MM sequentially 2,750 2,700 64 5 (21) 274…
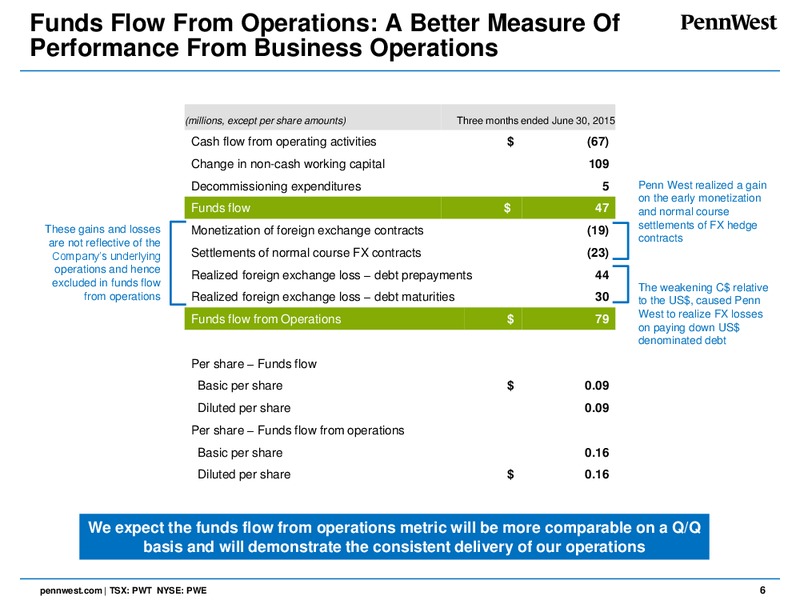
Funds Flow From Operations: A Better Measure Of Performance From Business Operations (millions, except per share amounts) Three months ended June 30, 2015 Cash flow from operating activities (67) Change in non-cash working capital…
Revised Guidance A Prudent Move in Lower Commodity Price Environment Reduced our CAD crude oil price assumption to C60/bbl, which is approximately equivalent to WTI US50/bbl adjusting for FX rates and differentials Funds flow from…
Hedging Update: Downside Protection in Volatile Environment Added several additional crude oil hedges during and subsequent to quarter end as part of on-going program to protect funds flow Notional Volumes Pricing Contract Term…
Q2/15 Financial & Operating Bridges Q2/15 Production Reconciliation Average volumes were lower sequentially 100 primarily as a result of spring break-up Production (mboe/d) 95 95 interruption impacting development (1.0)…
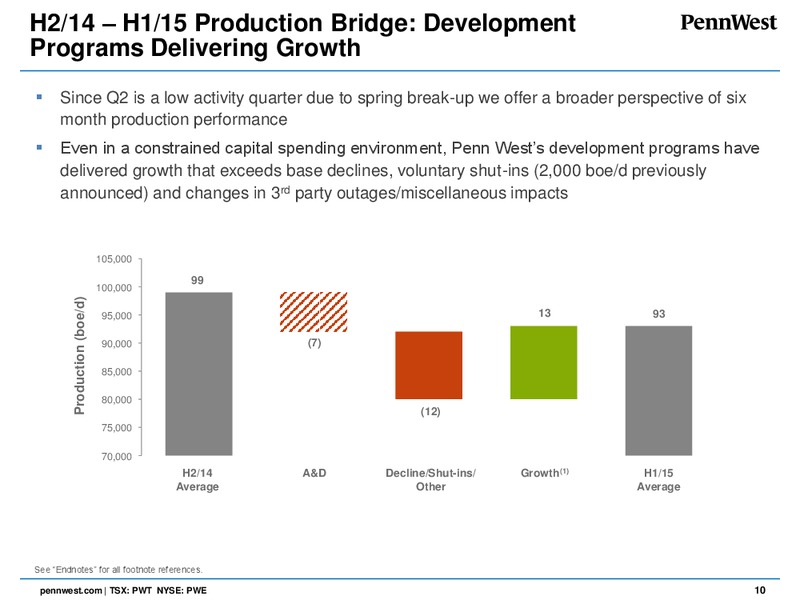
H2/14 H1/15 Production Bridge: Development Programs Delivering Growth Since Q2 is a low activity quarter due to spring break-up we offer a broader perspective of six month production performance Even in a constrained capital spending…
Quarterly Cash Costs The Company continues to focus on and demonstrate success in cost reduction efforts Remaining competitive on cost structure is a key driver of success in low commodity cycles 400 Quarterly Cash Cost…
Operated Development Activity Cardium H1/15 - total well costs were reduced by over 20% at PCU 9, J-Lease and Easyford over H2/14 costs Cardium results remain generally in-line with internal expectations despite variances between…
Penn West Corporate Drivers North American Light Oil and Liquids Play Ranking by PIR(1)(2)(3) PWT has high-graded its capital program to focus on areas that provide strong Dodsland returns relative to North Viking West Pembina…
Core Programs Remain Economic at Low Prices Penn Wests H1/15 capital programs in the Cardium, Viking and PROP were focused on adding high-margin barrels H2/15 programs will continue to focus on adding high margin barrels and provide…
 Loading...