IFRS Financial and Operating Results for First Quarter 2012 May 22, 2012
Agenda Highlights, Macro Alexey Yankevich Member of the Management Board, Environment, CFO Financials Vadim Yakovlev Upstream Deputy Chairman of the Management Board, First Deputy CEO Downstream Vladimir Konstantinov Head…
Strong financial performance while advancing on strategic goals 1Q 2012 Financial performance: Revenue: RUB 278 bln (+20% Y-o-Y) EBITDA*: RUB 79 bln (+11% Y-o-Y) Net Income: RUB 48 bln (+21% Y-o-Y) Continued operational progress:…
Macro Environment Stronger prices, demand and ruble 55
Crude prices continue to rise; taxes and market conditions favor Upstream margins Crude & Product prices Netbacks, /bbl 118.6 109.4 105.4 26.50 26.46 23.82 Crude Oil export duties, USD/tonne Increase in global crude…
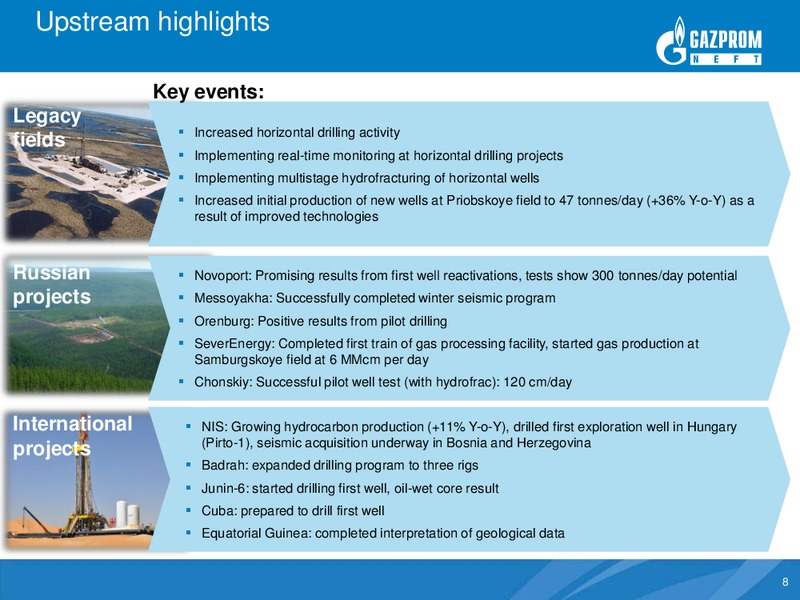
Upstream New projects on track, continuing resource base extension, efficient development of legacy fields 77
Seasonal 1Q production decline is due to reverse in rest of year Group hydrocarbon production 1Q12 vs 1Q11 reconciliation +6% -2% Hydrocarbon production (toe) decreased 2% Q-o-Q due to Hydrocarbon production increased 6% Y-o-Y due…
Efficiency and optimization efforts deliver industry- leading cost control % change in opex/boe 1Q 2012 Y-o-Y, RUB/boe % change in capex/boe 1Q 2012 Y-o-Y, RUB/boe Reduced opex/boe due to: Moderate growth of capex/boe due to:…
New technologies will sustain production and increase returns at mature fields Base cost Base flow Gazprom Neft RUB 50-70 mln 30-50 tonnes/day practice Vertical and directional drilling Increased well cost Increased well…
New technologies raising production at Priobskoye field Priobskoye field production, MTonnes/day Priobskoye field development Units Tonnes/day forecast Raised initial production rates by implementing new hydrofracturing…
Downstream Premium channel sales increase as investments improve product quality in industry-leading portfolio 13 13
Refinery modernization raises fuel quality, drives continued premium sales growth 1Q12 Key Events: 2012 Major Goals: Refining Stream FCC gasoline and diesel Refining volumes up 8% 1Q hydrotreaters at Omsk, increasing high- 2012 over…
Refining netbacks decreased, but reversed in April Gazprom Neft crude mix Gazprom Neft average netbacks (MMTonnes) /bbl Crude to CIS & Russia Crude Exports Refining Refining cover increased from 77% to 78% Y-o-Y Crude…
Increased refining throughputs and higher-value product yield Gazprom Neft refining throughput Gazprom Neft gasoline and diesel yields (MMTonnes) (MMTonnes) Gasoline Diesel NIS Slavneft Moscow Omsk Increased…
4 Continuing development of domestic and international premium channels Acquired 6 stations Opened refueling complex 1Q11 vs. 1Q12 premium Market in St. Petersburg at Sheremetyevo sales growth share Retail Acquired 6 stations,…
Financials 21% Net Income Growth Y-o-Y 18 18
Production growth and strong price environment drive positive financial trends Revenue grew by 2.2% Q-o-Q due to increased oil prices, partially offset by lower crude oil sales Revenues volumes RUB bln Revenue grew by 19.8% Y-o-Y…
EBITDA reconciliation 1Q12vs.1Q11 EBITDA 1Q 2012 vs 1Q 2011, RUB mln EBITDA reconciliation 2011vs.2010 (13,782) (1,879) 27,374 3,407 1,355 578 79,261 (13,293) 1,052 2,816 71,632 18,320 9,911 Changes in Net Price = 1 828…
EBITDA reconciliation 1Q12vs.4Q11 EBITDA 1Q 2012 vs 4Q 2011, RUB mln (3,177) (2,148) 5,979 2,301 79,261 77,312 5,428 (7,160) (1,325) 519 1,532 7,870 18,320 Changes in Net Price = -1 078 69,442 60,942 4Q 2011 Price…
Strong free cash flow generation Cash flow reconciliation 1Q12 RUB bln Bank deposits *Includes changes in investments in associated companies and proceeds from such investments 22 22
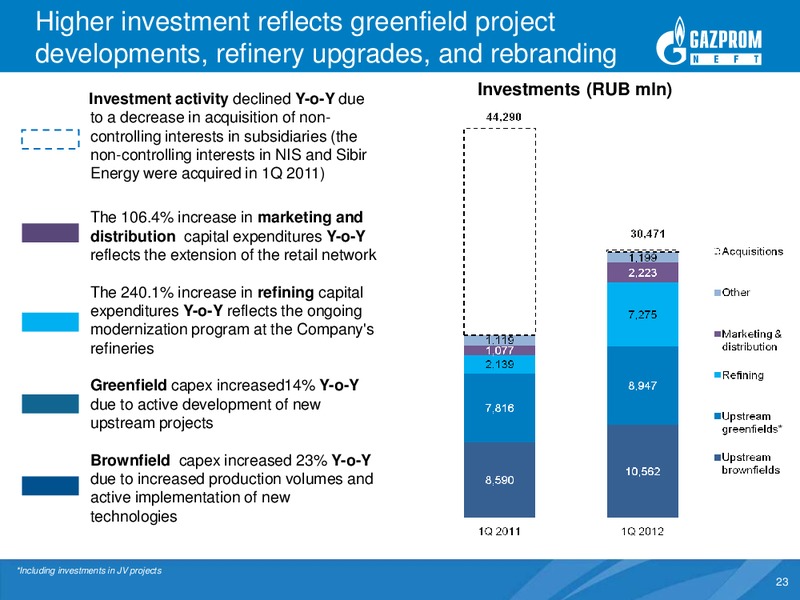
Higher investment reflects greenfield project developments, refinery upgrades, and rebranding Investments (RUB mln) Investment activity declined Y-o-Y due to a decrease in acquisition of non- controlling interests in subsidiaries…
Continued improvements in balance sheet and debt portfolio Debt ratios and maturity mix Debt by currency Net debt/EBITDA 0.6 vs. target < 1.5 Reduced average interest rate to 3.34% Y-o-Y Increased share of short term debt to 24% in…
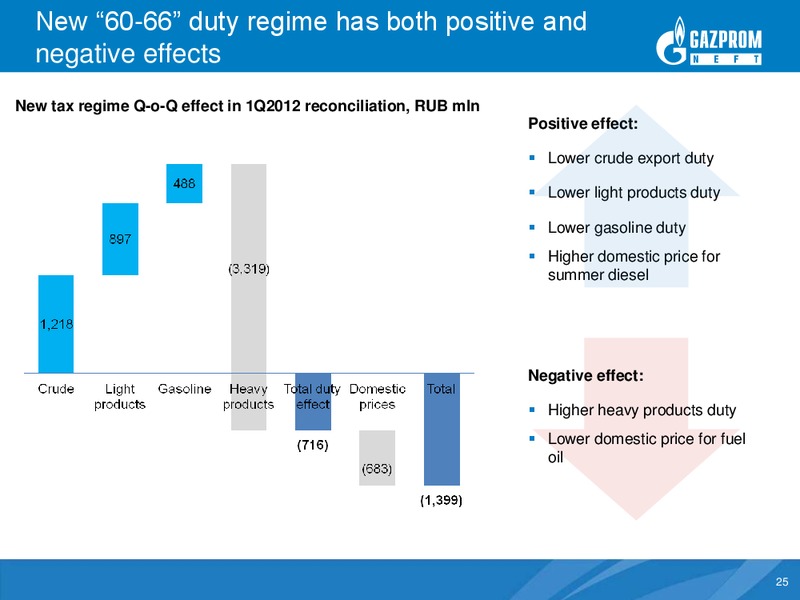
New 60-66 duty regime has both positive and negative effects New tax regime Q-o-Q effect in 1Q2012 reconciliation, RUB mln Positive effect: Lower crude export duty Lower light products duty Lower gasoline duty Higher domestic…
 Loading...