2015 Continuous Execution of Core Strategy Raven Annual Shareholders Meeting May 21, 2015
Raven Business Model Market Segments Served FY 2015 Serve diversified market segments Manage a pipeline of growth initiatives 19% 17% Compete on quality, service, innovation ATD ATD OEM and peak performance ATD OEM Aftermarket ATD…
Raven Market Segment Conditions Current Market Segment Condition 2-Year Outlook for Market Segments 33% 45% 61% 55% 6% Challenging Slow Normal Challenging Slow Normal
Course to Recovery Restructuring Actions Fiscal Year 2016 Impact = 20.0M 23 million annualized operating expenses reduced since Nov. 2014 13.5% of total operating 40% expenses Critical R&D has been 60% preserved Labor Reduced…
Applied Technology Field Computers Guidance & Steering Precision Agriculture since 1978 Helping to feed the world by enabling farmers to: Reduce operating costs Control inputs Boom Controls Application Controls Improve yields…
Applied Technology Strategic Initiatives ATD Financial Performance Develop and deliver machine 200 control solutions for each 180 172 170 phase of commodity crop 160 145 142 production Numbers in Millions 140 Deliver a quality…
Applied Technology FY15 Successes Outlook SBG Integration and contribution Very difficult market conditions Introduced Hawkeye Nozzle through FY 2016 Control Significant progress on strategic AGCO strategic partner OEM projects…
Engineered Films Value-added and in-demand solutions for an Agriculture: 19% of Sales array of end markets Largest specialized manufacturing lines in the Silage Covers industry with 605,000 Grain Covers sq. ft. of capacity…
Engineered Films Strategic Initiatives EFD Financial Performance Develop and acquire market 180 167 leading technologies & 160 148 manufacturing capabilities 134 142 140 Grow value-added product Numbers in Millions 120 sales…
Engineered Films FY15 Successes Outlook 20% operating income growth Grow revenues by 10% in non- over prior year energy segments 90 bps operating margin Realize strategic conversion and improvement over prior year distribution…
Aerostar Division Life-saving solutions enhance situational Aerospace Solutions awareness and safety Advanced radar sensors Tethered Aerostats High Altitude Balloons World leading lighter than air platforms Project Loon Integrated…
Aerostar Division Strategic Initiatives Aero Financial Performance Increase and exploit our 120 108 competitive position in 104 102 stratospheric balloon 100 91 solutions 81 Numbers in Millions 80 Aggressively invest in Vista…
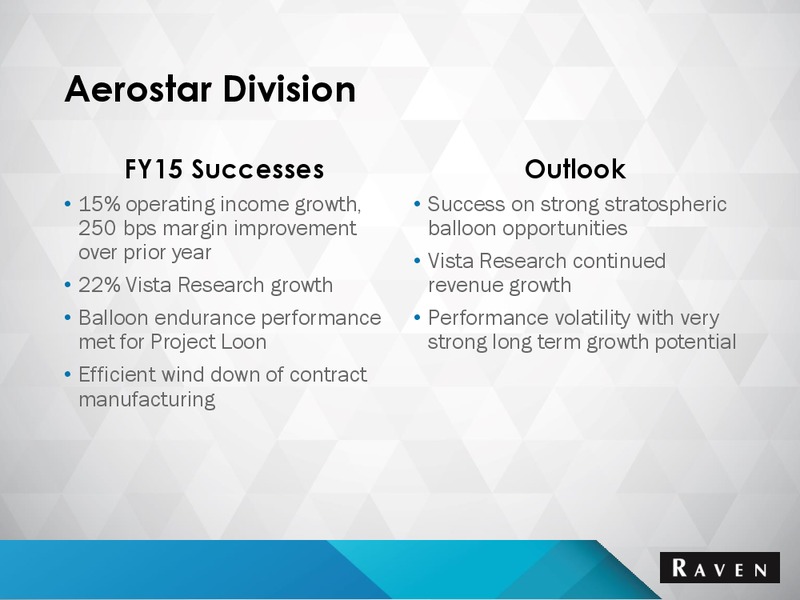
Aerostar Division FY15 Successes Outlook 15% operating income growth, Success on strong stratospheric 250 bps margin improvement balloon opportunities over prior year Vista Research continued 22% Vista Research growth revenue…
FY 2016 Outlook Continued challenges in ATD and EFD energy end markets will prevent earnings growth. Operating expenses will be substantially lower, allowing profit improvements on revenues realized. Measurable progress with…
Long Term Priorities & Goals Remain true to our Vision and uphold the Raven Values Preserve the Core business and return to 10% earnings growth goals Improve our returns on growth investments
Long Term Growth Model DIVISION TARGET % of POINT EST GROWTH DRIVERS GROWTH MID PT TARGET OPERATING INCOME ATD Market Expansion 2.00% - 4.00% 3.00% New Products 3.00% - 6.00% 4.50% International Expansion 1.00% - 5.00% 3.00% Small…
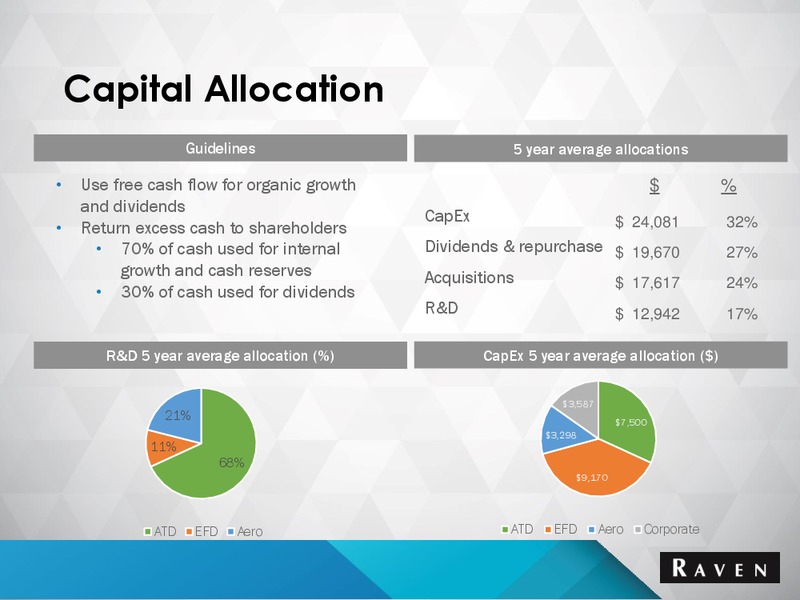
Capital Allocation Guidelines 5 year average allocations Use free cash flow for organic growth % and dividends CapEx 24,081 32% Return excess cash to shareholders 70% of cash used for internal Dividends & repurchase 19,670 27%…
 Loading...