US GAAP Financial and Operating Results for Second Quarter 2011 3 August 2011
Management participating in this call Alexey Yankevich Head of Economics and Corporate Planning Directorate Boris Zilbermints Deputy Chairman of the Management Board Deputy CEO for Exploration and Production Vladimir…
Strong financial performance while advancing on 2020 strategic goals Financial performance in 1H 2011: Revenue: US 21,341 mln (+39.3% Y-o-Y) EBITDA: US 4,945mln (+57.7% Y-o-Y) Net Income: US 2,604 mln (+73,5% Y-o-Y) Continued…
Domestic product prices recover to align with high global crude price environment Brent, /bbl Average exchange rate Inflation (PPI), % Omsk refinery netback prices /tonne for unleaded 92 petrol 650 Growth in global crude and…
Upstream New projects on track, upgrading production base 88
New projects driving domestic growth while international expansion continues 111 Key Events: 2011 Major Goals: New Source Cenomanian gas: full scale production Cenomanian gas: produce 3.2 MMtoe Messoyakha: seismic complete; drilling…
MMToe M Kboepd k Mtoe Production growth continues for fourth straight quarter Group hydrocarbon production +8% +1% Total Group hydrocarbon production increased by SPD was a key contributor to production 1.2% Q-o-Q and 7.7%…
Modern technology will drive improved recovery at older fields Gazprom Neft and Schlumberger signed a technology cooperation agreement to increase E&P efficiency in Gazprom Nefts domestic and international operations Weatherford…
MET relief raises profitability of Projects in YNAO, but further tax reforms still necessary Company Field Accumulated Tax relief Yamal peninsula Gydan Production* effect** Messoyakha 50 MMTonnes 98.6 bln RUB SeverEnergy 33.3…
New projects gain significant value under new tax incentives 100% (Gazprom transfer) 50% (JV with TNK-BP) Reserves: 404 MmToe 2012-2021 MET relief (approved 21 July) Reserves: 513 MmToe Startup: 2014 Startup: 2015 and 60-66 tax…
Downstream Fuel quality upgrades and increase in marginal sales add value to industry-leading portfolio 14 14
Refinery modernization raises fuel quality, drive continued premium sales growth 2Q11 Key Events: 2011 Major Goals: Refining Refining volumes up 19% 2Q Begin construction of isomerization 2010/2Q 2011 units at Moscow and Yaroslavl…
Upgraded fuel quality adds value to increased refining runs Gazprom Neft refining throughput Gazprom Neft gasoline and diesel yields (MMTonnes) 2Q10 2Q11 MMTonnes +9.4% +18.9% 12 Gasoline 11% 21% 10.32 28% 10 0.67 9.43 8.68…
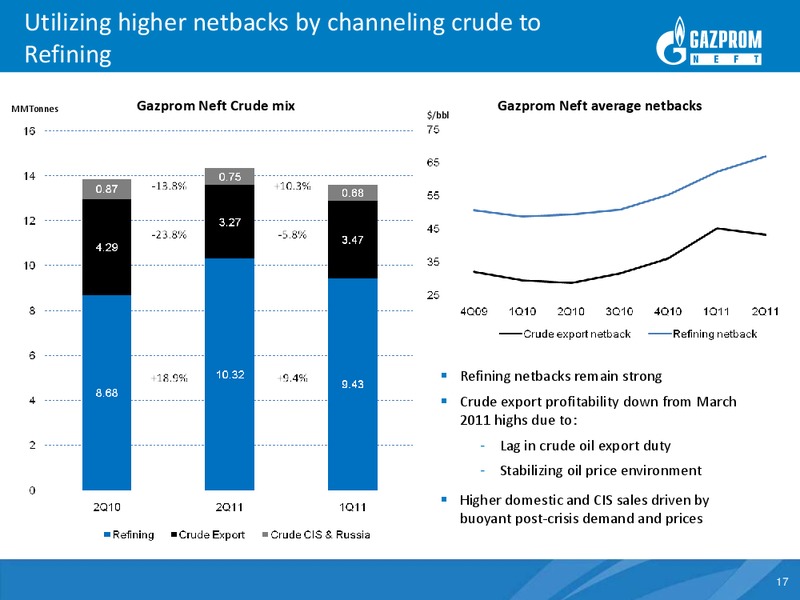
70 20 Utilizing higher netbacks by channeling crude to Refining MMTonnes Gazprom Neft Crude mix /bbl Gazprom Neft average netbacks Refining netbacks remain strong Crude export profitability down from March 2011 highs due to: -…
High growth premium channels continue strong performance Y-o-Y 2Q premium* Market share** sales increase G-Drive premium branded motor fuel achieved 16% share of high octane market in Saint 37% Petersburg Retail Increased…
Financials Strong results on higher volumes and prices 19 19
Volume and pricing strength leverage 74% net income expansion Y-o-Y Increased sales volume and higher crude and petroleum prices drove 16.3% revenue Revenues increase US mln Average Urals price increased10.8% Q-o-Q and 42% Y-o-Y…
Y-o-Y EBITDA growth driven by price, volume and improved sales mix Management effectiveness = 405 4,945 OPEX = - 172 SG&A = - 29 Exploration expenses = 11 3,136 Changes in Net price = 1 386 21 21
Volumes and tariffs growth lead to larger Opex 22 22
Free cash flow boosted due to working capital stabilization Cash reconciliation:. 1H11 vs. YE2010 US mln Free cash flow 23 23
Growth and improvement program continues to drive capex Capex Comparisons (US mln) 45,9% Capital spending program continues to focus 21,5% on growth and competitive improvement 893 4 67 157,7% Quarterly E&P capex up 27.5% vs. 1Q…
Continued commitment to capital discipline and debt optimization Gearing ratio and maturity mix Debt by currency Signed US 600 mln unsecured 5 year Net debt/EBITDA 0.8 vs. target < 1.5 club deal in April 2011 Share of short term…
Questions & Answers 26 26
Appendix 27 27
Q-o-Q EBITDA growth was tempered by duty lag effect Management effectiveness = 164 2,467 2,478 Changes in Net Price = -49 OPEX = -10 SG&A = 78 Exploration expenses = 11 28 28
Q-o-Q Opex growth driven by real Ruble appreciation and increase in upstream activity 29 29
Units bbl barrel boe barrel of oil equivalent tonne metric ton toe tonnes of oil equivalent MMTonnes million tonnes MMbbl million barrels MMboe million barrels of oil equivalent Mmtoe million tonnes of oil equivalent bcm billion…
 Loading...