2015 half year Group results 22nd July 2015 www.morganadvancedmaterials.com
Agenda 2015 half year Group results Operational update Summary 2
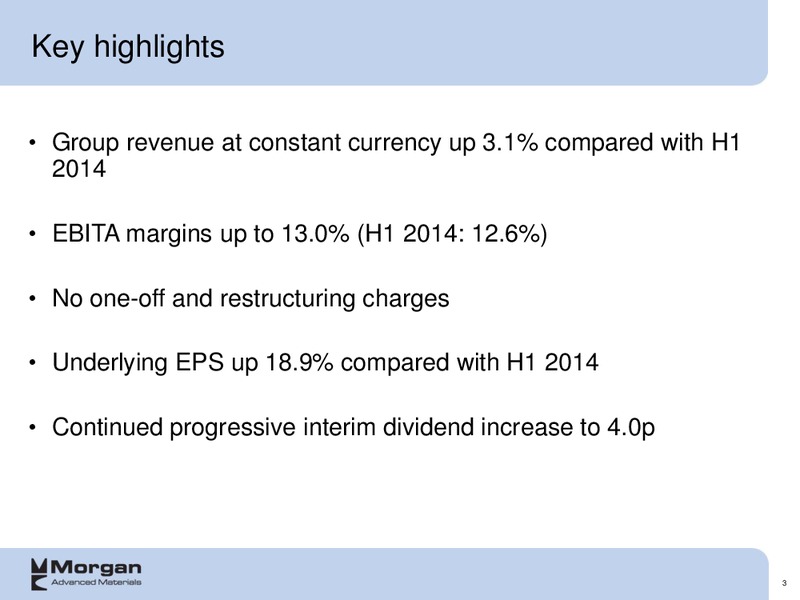
Key highlights Group revenue at constant currency up 3.1% compared with H1 2014 EBITA margins up to 13.0% (H1 2014: 12.6%) No one-off and restructuring charges Underlying EPS up 18.9% compared with H1 2014 Continued…
2015 half year Group results 4
Good revenue growth and margin improvement; underlying EPS up 18.9% H1 2015* H1 2014* % change from H1 2014 At constant As reported currency m m % % Revenue 469.2 448.4 4.6% 3.1% EBITA before restructuring** 61.1 56.4 8.3% 5.3%…
Restructuring costs, financing costs and tax rate Before specific Specific Total adjusting items adjusting items Total H1 2015 H1 2014 H1 2014 H1 2014 m m m m Revenue 469.2 448.4 0.0 448.4 EBITA before restructuring* 61.1 56.4 0.0…
Improving cash flow from operations; significant capital investment H1 2015 H1 2014 m m Operating working capital/sales ratio of Cash from trading* 74.9 70.4 22.1% (H1 2014: Change in working capital (10.1) (21.4) 22.9%) Change in…
Revenue growth at constant currency in all regions and margin improving in North America and Europe million Revenue EBITA* Profit Margins % H1 2015 H1 2014 H1 2015 H1 2014 H1 2015 H1 2014 North America 191.6 171.7 29.8 26.2 15.6%…
North America revenue growth and further improvement in margins H1 2015 revenue 2.5% higher than H1 2014 at constant currency Continued strong performance by Thermal Ceramics and growth in Electrical Carbon and Certech more than…
Europe revenue growth and margin improvement Organic sales*** at constant currency increased 4.7% driven by growth in Thermal Ceramics and recovery in C&DS more than offsetting weaker Technical Ceramics business Porextherm,…
Asia/RoW good revenue growth except China Revenue marginally up by 0.6% at constant currency, reflecting good growth in South East Asia and India, particularly for Thermal Ceramics and Seals and Bearings, being offset by a 9.3%…
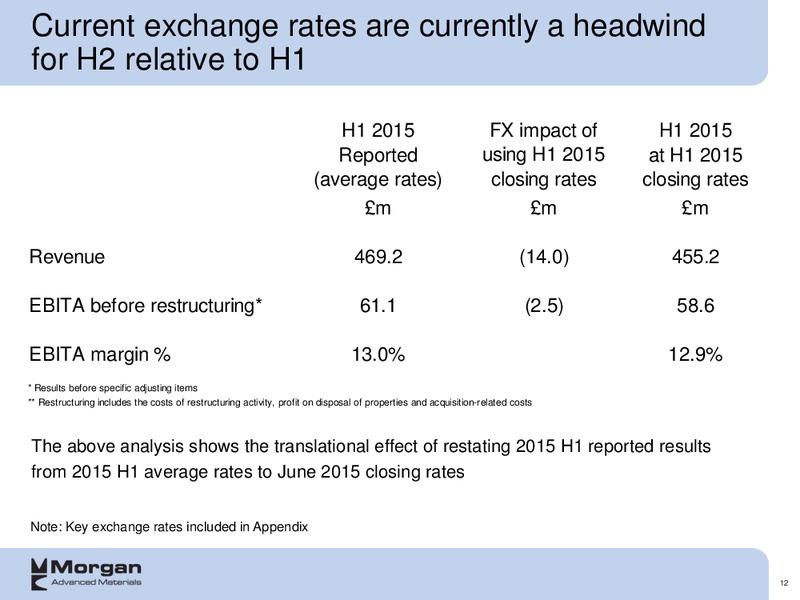
Current exchange rates are currently a headwind for H2 relative to H1 H1 2015 FX impact of H1 2015 Reported using H1 2015 at H1 2015 (average rates) closing rates closing rates m m m Revenue 469.2 (14.0) 455.2 EBITA before…
Financial summary Revenue growth at constant currency of 3.1% EBITA margin at 13.0% Underlying EPS up 18.9% Improved operating cash flow Interim dividend increase to 4.0p 13
Operational update 14
H1 2015 revenue and EBITA margins by product/technology group H1 EBITA margins 17.6% 13.1% 14.8% 5.2% 12.7% 13.0% 3.7% 15
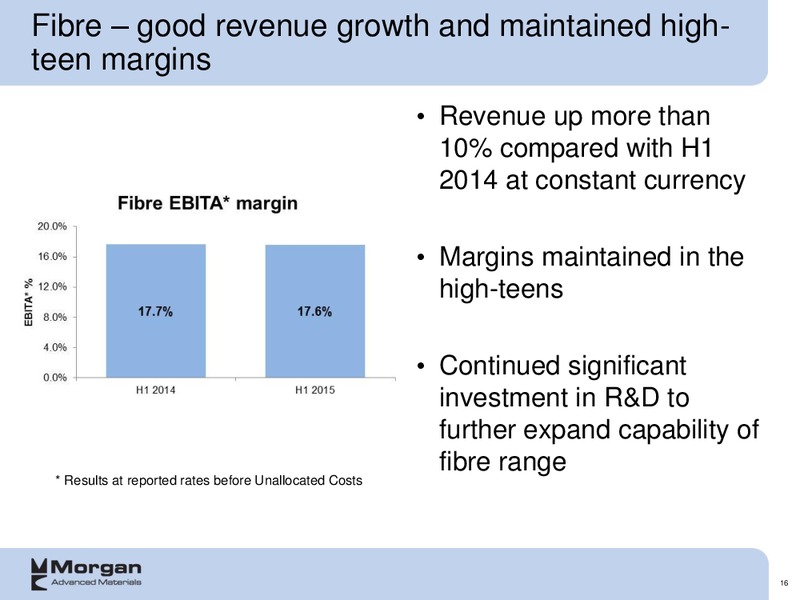
Fibre good revenue growth and maintained high- teen margins Revenue up more than 10% compared with H1 2014 at constant currency Margins maintained in the high-teens Continued significant investment in R&D to further expand…
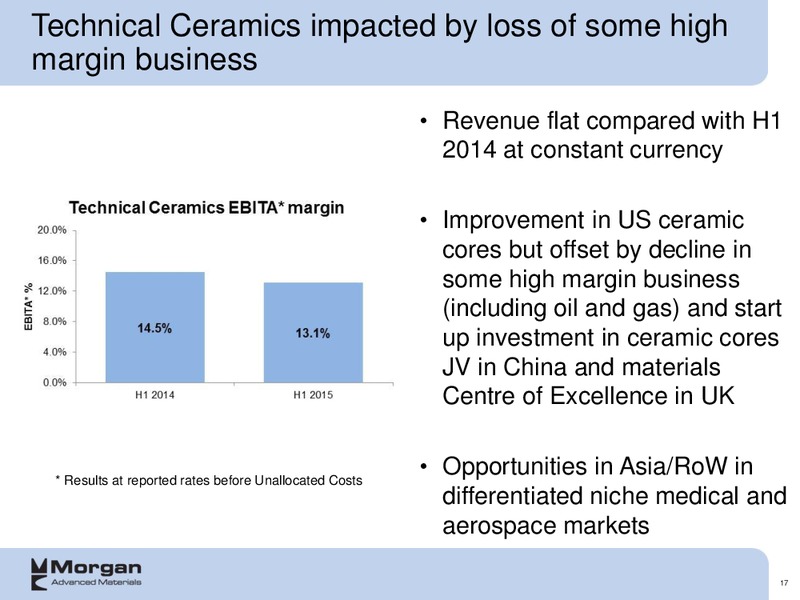
Technical Ceramics impacted by loss of some high margin business Revenue flat compared with H1 2014 at constant currency Improvement in US ceramic cores but offset by decline in some high margin business (including oil and gas) and…
Electrical Carbon maintained its mid-teen margins Strong margin improvement has been maintained Revenue flat, with North America growth offsetting decline in China Materials plants consolidation and grade rationalisation…
IFB**/castables margin impacted by lower volumes due to decline in project work, mainly in Asia IFB is one of the most volume sensitive product lines due to the continuous manufacturing process and the 6.1% reduction in sales, due…
Significant improvement continues in Seals and Bearings EBITA margin improvement from positive mix change, increased volumes and operational initiatives Initial benefits of material plants consolidation and grade…
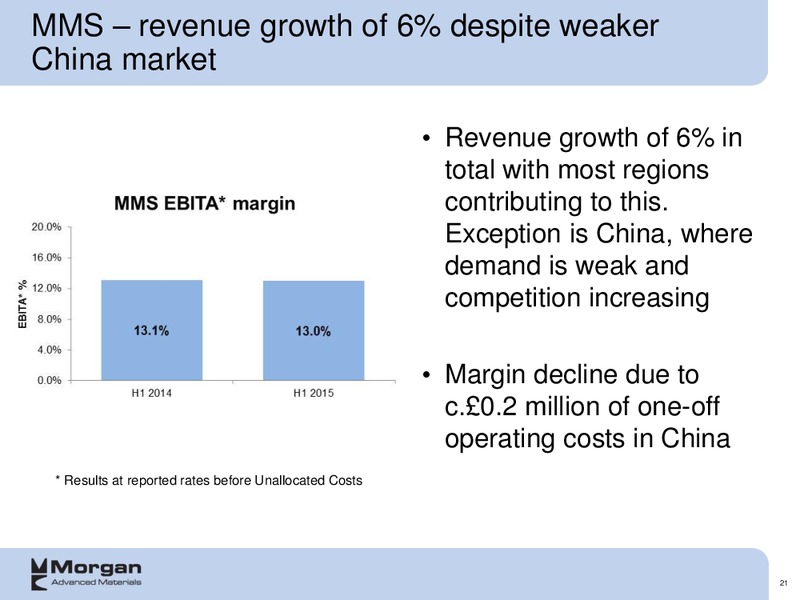
MMS revenue growth of 6% despite weaker China market Revenue growth of 6% in total with most regions contributing to this. Exception is China, where demand is weak and competition increasing Margin decline due to c.0.2 million…
C&DS continuing to transition away from traditional UK MoD contracts Revenue of 16.4 million running at similar level to 2014 and expect close to 40 million for full year UK MoD still an important customer but increasingly looking…
R&D investment increased to 2.7% of revenue Increasing investment in R&D 2.7% of revenue in H1 2015 (2014: 2.3%, 2013: 2.1%) Global Materials Centre of Excellence for Structural Ceramics (Stourport, UK) established and additional…
Significant capital expenditure Total capex is 2x depreciation in H1 2015 including c.12m of spend buying out the long lease on the Swansea site adjusting for this base capex is c.1.4x depreciation Key projects: Expansion of South…
Summary 25
Summary EBITA margins of 13.0% despite mixed market conditions No one-off restructuring charges in the period; improved EBITA and reduced finance charges leads to 18.9% increase in underlying EPS supporting progressive increase in…
2015 half year Group Results 22nd July 2015 www.morganadvancedmaterials.com
Appendix 28
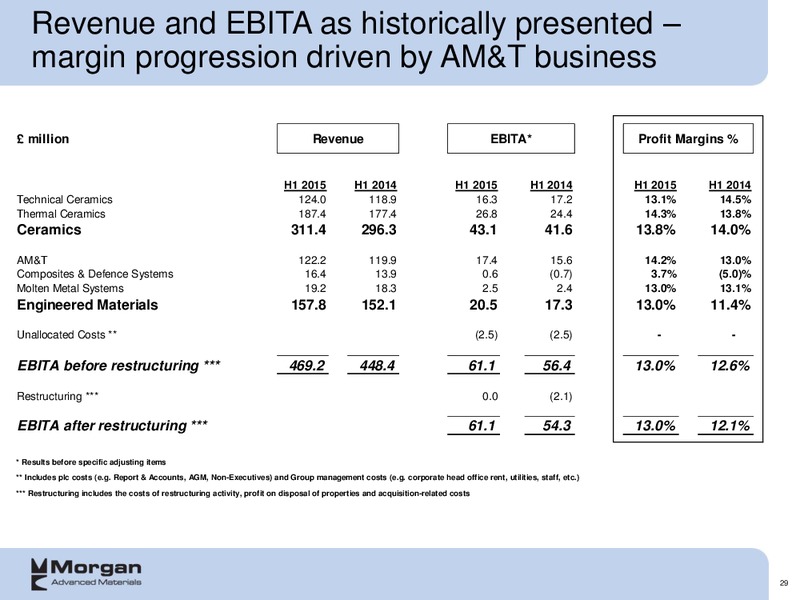
Revenue and EBITA as historically presented margin progression driven by AM&T business million Revenue EBITA* Profit Margins % H1 2015 H1 2014 H1 2015 H1 2014 H1 2015 H1 2014 Technical Ceramics 124.0 118.9 16.3 17.2 13.1% 14.5%…
EBITA margins before restructuring and one-off items Results before specific adjusting items 31
EBITA margins after restructuring and one-off items Results before specific adjusting items 32
End-market mix across regions H1 2015 revenue by market 33
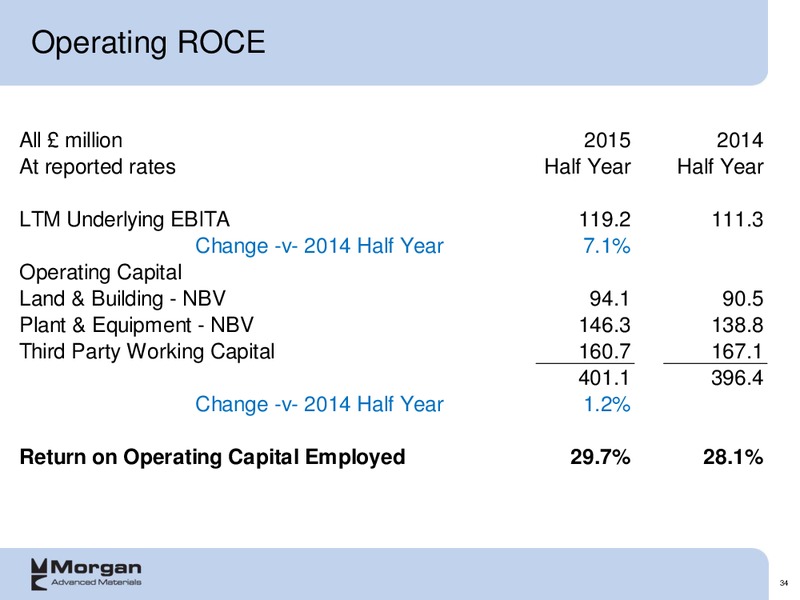
Operating ROCE All million 2015 2014 At reported rates Half Year Half Year LTM Underlying EBITA 119.2 111.3 Change -v- 2014 Half Year 7.1% Operating Capital Land & Building - NBV 94.1 90.5 Plant & Equipment - NBV 146.3 138.8 Third…
Net financing costs H1 2015 H1 2014 m m Bank interest charge 7.0 8.3 Bank interest income (0.9) (0.8) Net interest on IAS19 obligations 3.4 3.0 Amounts derived from financial instruments (1.0) - 8.5 10.5 35
Underlying EPS H1 2015 H1 2014 m m Basic earnings from continuing operations 32.4 23.9 Amortisation 3.6 4.3 Specific adjusting items 0.0 2.0 Underlying earnings 36.0 30.2 Weighted average number of shares in the period 285.1m…
2015 half year Group results 22nd July 2015 www.morganadvancedmaterials.com
 Loading...