Oil and Natural Gas in Sub-Saharan Africa August 1, 2013 U.S. Energy Information Administration Independent Statistics & Analysis www.eia.gov
Sub-Saharan Africa Source: U.S. Department of State 2
Liquid Fuels Reserves and Production in Sub-Saharan Africa 3
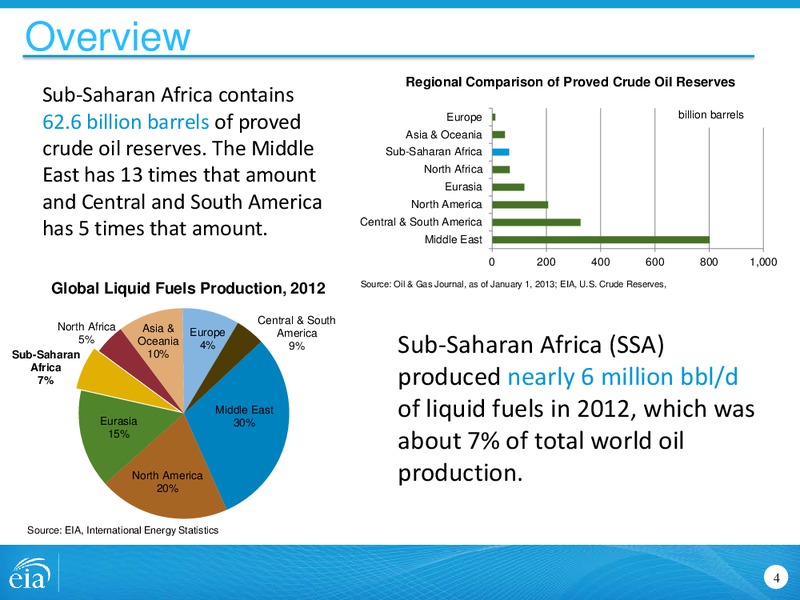
Overview Regional Comparison of Proved Crude Oil Reserves Sub-Saharan Africa contains 62.6 billion barrels of proved Europe Asia & Oceania billion barrels crude oil reserves. The Middle Sub-Saharan Africa East has 13 times that…
Liquid Fuels Production in Sub-Saharan Africa million barrels per day 7 projections 6 Baseline 5 Low scenario 4 2003 2004 2005 2006 2007 2008 2009 2010 2011 2012 2013 2014 Source: EIA, Short-Term Energy Outlook Oil…
Nigeria has been the top liquid fuels producer in the SSA region, followed by Angola. Together they made up 75% of total liquid fuels produced in Sub-Saharan Africa in 2012. Top SSA Liquid Fuels Producers in 2012 Production Angola…
Unplanned disruptions caused by oil theft and pipeline damage compromises a substantial portion of Nigerias crude oil production. Crude oil production peaked at 2.44 million bbl/d in 2005. Despite new production coming online, crude oil…
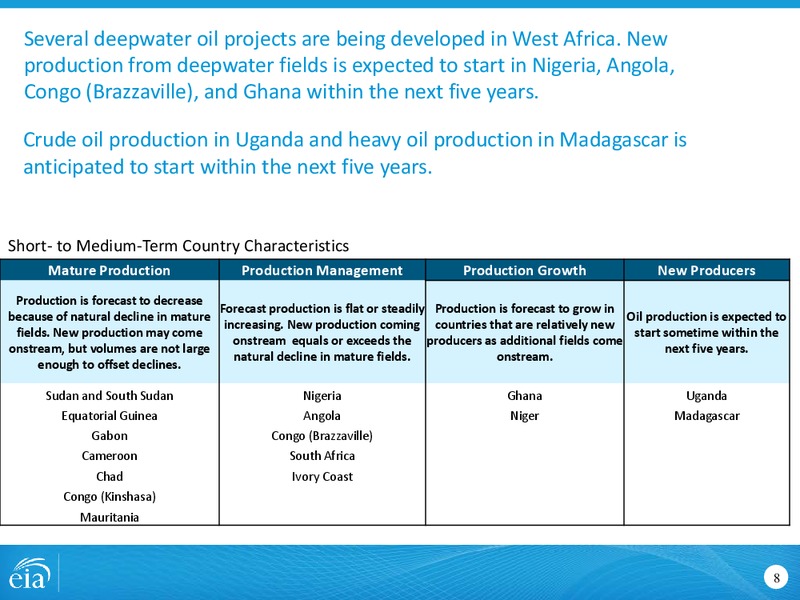
Several deepwater oil projects are being developed in West Africa. New production from deepwater fields is expected to start in Nigeria, Angola, Congo (Brazzaville), and Ghana within the next five years. Crude oil production in…
Oil Exports 9
China was the largest crude oil importer from Sub-Saharan Africa in 2012, followed by the United States. Angola is the second leading exporter of crude to China and accounted for 15% of Chinas crude oil imports in 2012. Sub-Saharan…
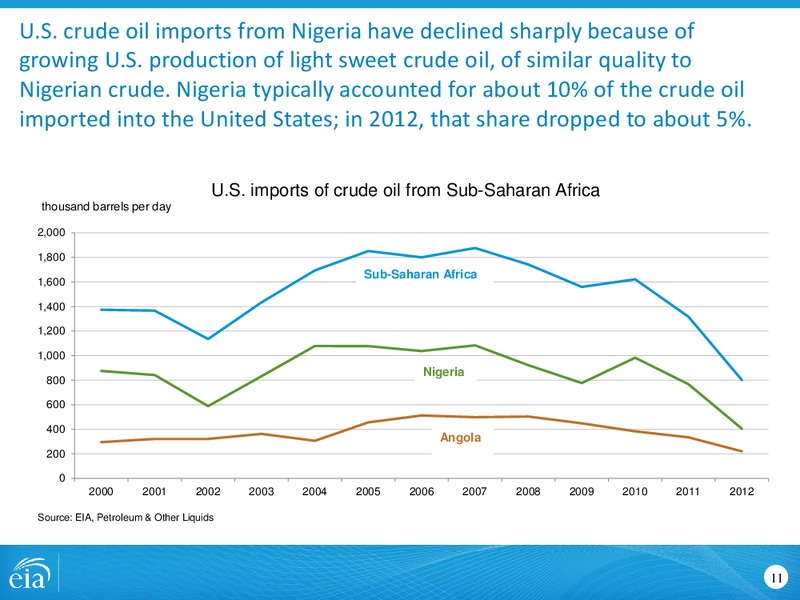
U.S. crude oil imports from Nigeria have declined sharply because of growing U.S. production of light sweet crude oil, of similar quality to Nigerian crude. Nigeria typically accounted for about 10% of the crude oil imported into the…
Nigeria exported around 2.2 million bb/d of liquid fuels in 2012. Exports diverted from the United States have been absorbed by the European Union, making the region the leading regional importer of Nigerias oil. Nigerias liquid fuels…
Natural Gas Production in Sub-Saharan Africa 13
Overview Regional Comparison of Proved Natural Gas Reserves Sub-Saharan Africa has 221.6 trillion cubic feet trillion cubic feet of proved Europe Sub-Saharan Africa natural gas reserves. The North Africa Middle East has almost 13…
billion cubic feet Natural Gas Production in Sub-Saharan Africa, 2002-2011 1,800 1,600 Natural gas production in Sub-Saharan Africa grew by an annual average of 10% 1,400 over the past ten years. 1,200 Growth was led by Nigeria,…
Natural Gas Exports 16
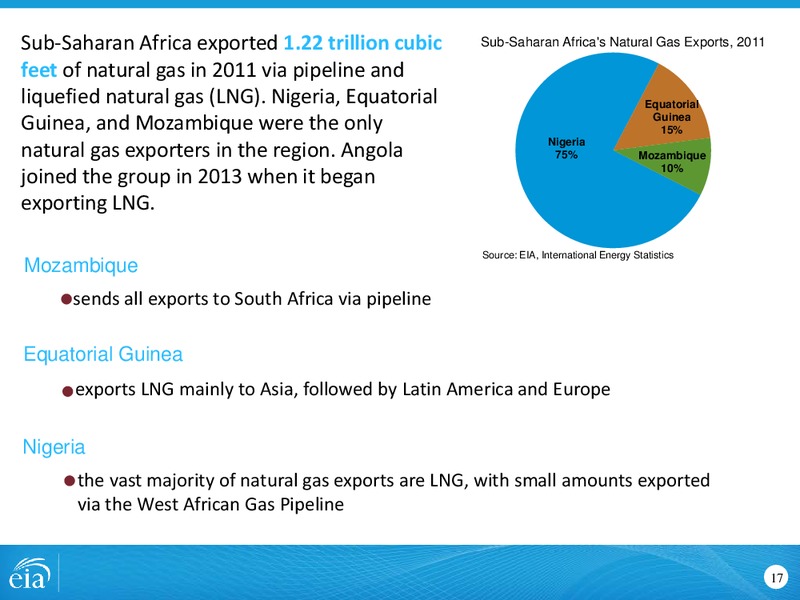
Sub-Saharan Africa exported 1.22 trillion cubic Sub-Saharan Africa's Natural Gas Exports, 2011 feet of natural gas in 2011 via pipeline and liquefied natural gas (LNG). Nigeria, Equatorial Equatorial Guinea, and Mozambique were the only…
Nigeria was the 4th largest LNG exporter in the world in 2012, accounting for 8% of total LNG exports worldwide. Nigeria exported about 950 bcf of LNG in 2012. Top 5 LNG Exporters in the World, 2012 billion cubic feet 4,000…
In 2012, Asia overtook Europe as the largest regional importer of Nigerias LNG. This is largely due to Japan, which more than doubled its LNG imports from Nigeria in 2012 compared with the previous year. Nigeria's LNG exports, by…
For more information U.S. Energy Information Administration home page www.eia.gov Country Analysis Briefs http://www.eia.gov/countries/ Annual Energy Outlook www.eia.gov/forecasts/aeo Short-Term Energy Outlook…
Supplemental Slides 21
Liquid fuels production in Sub-Saharan Africa is projected to grow by an annual average of 1% from 2010 to 2040. The region is expected to account for 7% of world supply growth during that period. Liquid Fuels Production, 2010 - 2040…
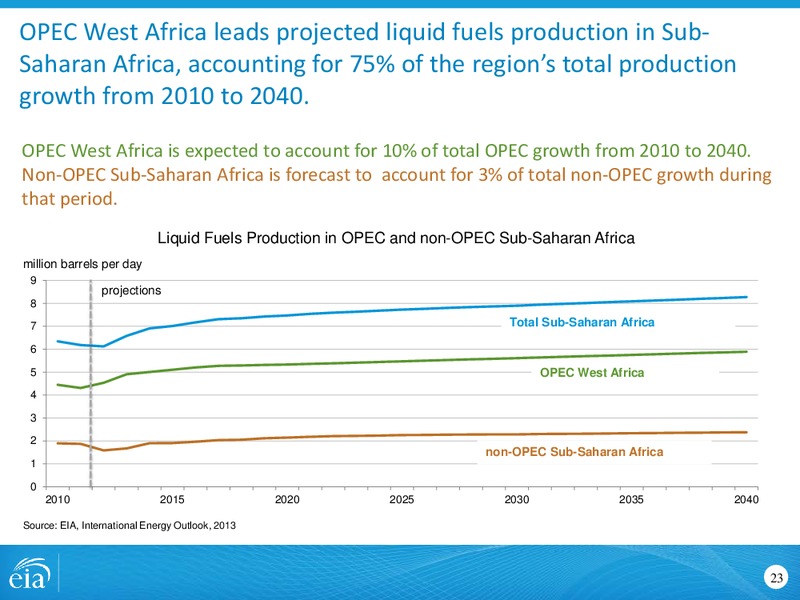
OPEC West Africa leads projected liquid fuels production in Sub- Saharan Africa, accounting for 75% of the regions total production growth from 2010 to 2040. OPEC West Africa is expected to account for 10% of total OPEC growth from 2010…
Natural gas production in Sub-Saharan Africa is projected to grow at an annual average rate of around 5% from 2010 to 2040. Dry Natural Gas Production in Sub-Saharan Africa, 2010-2040 trillion cubic feet 7 projections 6 Total 5…
West Africa is projected to dominate natural gas production in Sub-Saharan Africa in the long term, accounting for 81% of the regions natural gas growth from 2010 to 2040. Proved Reserves of Natural Gas, 2013 Nigeria is the 9th largest…
 Loading...