Williams and Williams Partners Second Quarter Earnings Call July 30, 2015
Second Quarter 2015 Summary & Outlook WMB adjusted EBITDA of 1.02 billion, up 32% vs 2Q 2014 Record WPZ DCF of 701 million and adjusted EBITDA of 1.01 billion, driven by fee-based revenue growth Adjusted EBITDA 2Q 2015 vs. 2Q 2014…
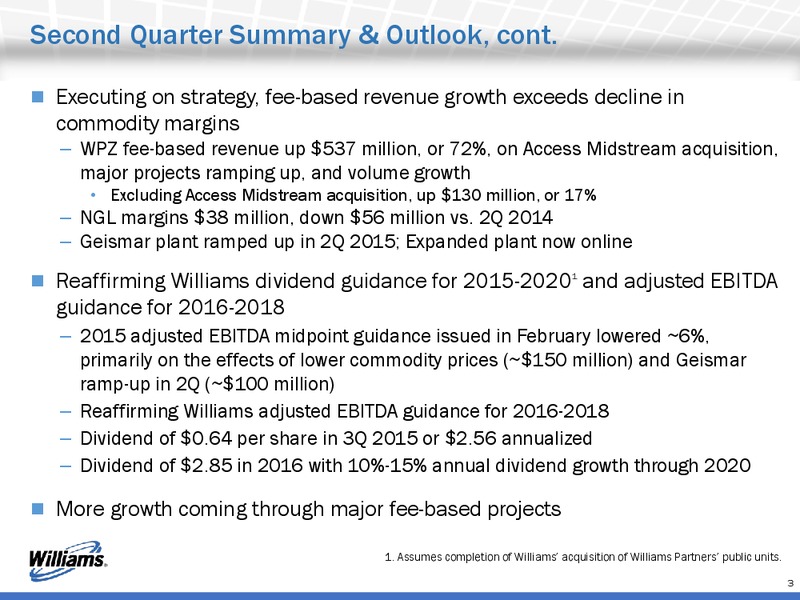
Second Quarter Summary & Outlook, cont. Executing on strategy, fee-based revenue growth exceeds decline in commodity margins WPZ fee-based revenue up 537 million, or 72%, on Access Midstream acquisition, major projects ramping up,…
WPZ: Large-scale, value-creating projects beginning to contribute; many more to come RECENT DEVELOPMENTS Transco: Rockaway Lateral and Northeast Connector projects: In-service May 2015 Transco: Mobile Bay South 3: In-service April 2015…
Williams uniquely positioned to connect best supplies to best markets, deliver strong growth Commissioned and ramping up large-scale assets Expect about 89% of WMB 2015-2017 gross margin coming from fee- based revenues 9.8 billion…
Forward Looking Statements
WMB Non-GAAP Reconciliations
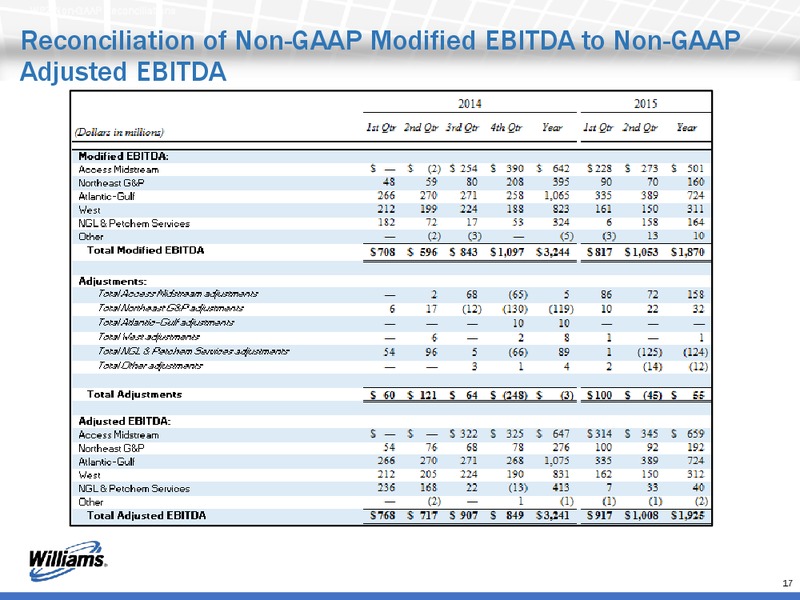
WMB Non-GAAP Reconciliations Reconciliation of Non-GAAP Modified EBITDA to Non-GAAP Adjusted EBITDA 11
Net Income to Adjusted EBITDA Reconciliation ( in millions) 2 0 1 5 2 0 1 6 2 0 1 7 2 0 1 8 Low Base High Low Base High Low Base High Low Base High Net income from continuing operations 634 709 784 1,255 1,385 1,515 1,570 1,720 1,870…
WPZ Non-GAAP Reconciliations
WPZ Non-GAAP Reconciliations Reconciliation of Non-GAAP distributable cash flow to GAAP net income 15
WPZ Non-GAAP Reconciliations Reconciliation of Non-GAAP distributable cash flow to GAAP net income contd 16
WPZ Non-GAAP Reconciliations Reconciliation of Non-GAAP Modified EBITDA to Non-GAAP Adjusted EBITDA 17
WPZ Non-GAAP Reconciliations Adjustments to Modified EBITDA by Segment 18
 Loading...