International Energy Outlook 2010 With Projections to 2035 International Association for Energy Economics June 9, 2010 Rio de Janeiro, Brazil Richard Newell, Administrator
Overview Outlook for overall global energy use and emissions Oil and other liquid fuels Natural gas Coal and electricity Summary of key trends Richard Newell, IAEE, June 9, 2010 2
Outlook for Overall Global Energy Use and Emissions Richard Newell, IAEE, June 9, 2010 3
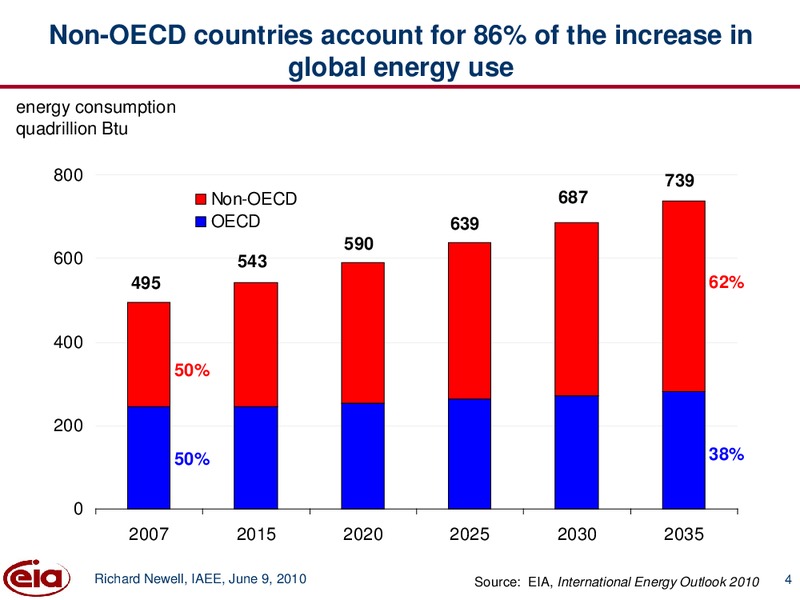
Non-OECD countries account for 86% of the increase in global energy use energy consumption quadrillion Btu 800 739 Non-OECD 687 OECD 639 590 600 543 495 62% 400 50% 200 50% 38% 0 2007 2015 2020 2025 2030 2035…
Economic activity and population drive increases in energy use; energy intensity improvements moderate this trend average annual change (2007-2035) percent per year 6 Population GDP per capita 5 Energy use per GDP 4 3 2 1…
Carbon intensity of energy declines in the future, but not as fast as energy intensity global indices Index, 2007=1.0 2.0 History Projections GDP per capita 1.5 CO2 emissions population 1.0 CO2 per unit energy 0.5 energy use…
Renewables are the fastest growing energy source (but from a relatively small base) world primary energy consumption quadrillion Btu History Projections 250 Liquids 30% (including biofuels) 200 28% 35% 22% Coal 150 Share of…
Assuming no policy changes, energy-related CO2 emissions grow 43% from 2007 to 2035 energy CO2 emissions billion metric tons 45 42 Non-OECD 39 40 OECD 36 35 34 30 32 67% 30 25 53% 20 15 10 47% 33% 5 0 2007 2015 2020…
Delivered energy use by sector, and primary energy use in the electric power sector in 2007 global energy use quadrillion Btu 250 Electricity delivered Nuclear Renewables 200 Coal Natural Gas 14% Liquids 15% 150 18% 7% 23%…
Oil and Other Liquid Fuels Richard Newell, IAEE, June 9, 2010 10
Non-OECD transportation fuel use surpasses almost flat OECD fuel use by 2025 transportation sector energy consumption quadrillion Btu 100 History Projections Non-OECD 80 60 OECD 40 20 0 2005 2010 2015 2020 2025 2030…
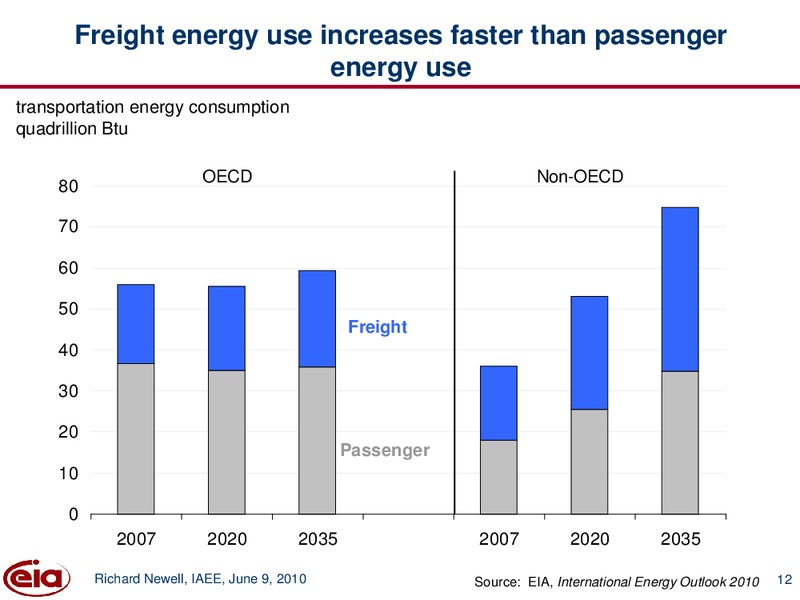
Freight energy use increases faster than passenger energy use transportation energy consumption quadrillion Btu OECD Non-OECD 80 70 60 50 Freight 40 30 20 Passenger 10 0 2007 2020 2035 2007 2020 2035 Richard…
The IEO reflects uncertainty in oil prices through a wide set of price cases light, sweet crude oil price 2008 dollars per barrel 225 History Projections 210 200 High Oil Price case 175 150 Reference case 133 125 100 75 50…
The high (low) oil price case assumes much lower (higher) production from key oil exporters liquids production in 2035 million barrels per day Low Oil Price case Reference case High Oil Price case 45 42 OPEC Non-OPEC 40 39 34 35…
OPEC producers maintain an approximate 40% share of total liquids production in the Reference case liquids production million barrel per day 120 History Projections 111 100 Total 85 80 60 52 48 Non-OPEC conventional 45 40…
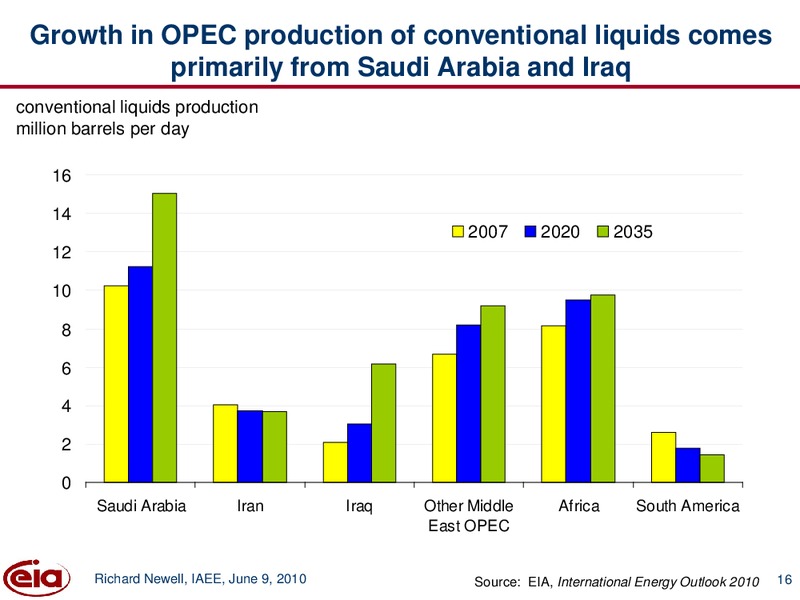
Growth in OPEC production of conventional liquids comes primarily from Saudi Arabia and Iraq conventional liquids production million barrels per day 16 14 2007 2020 2035 12 10 8 6 4 2 0 Saudi Arabia Iran Iraq Other…
Brazil, Russia, Kazakhstan, and U.S. lead increases in non- OPEC conventional supplies conventional liquids production million barrels per day 16 14 2007 2020 2035 12 10 8 6 4 2 0 Russia United Brazil Kazakhstan OECD…
Canadian oil sands and biofuels account for 70% of the increase in total unconventional liquids unconventional liquids production million barrels per day 6 5 2007 2020 2035 4 3 2 1 0 Oil sands/ Biofuels Extra-heavy…
Natural Gas Richard Newell, IAEE, June 9, 2010 19
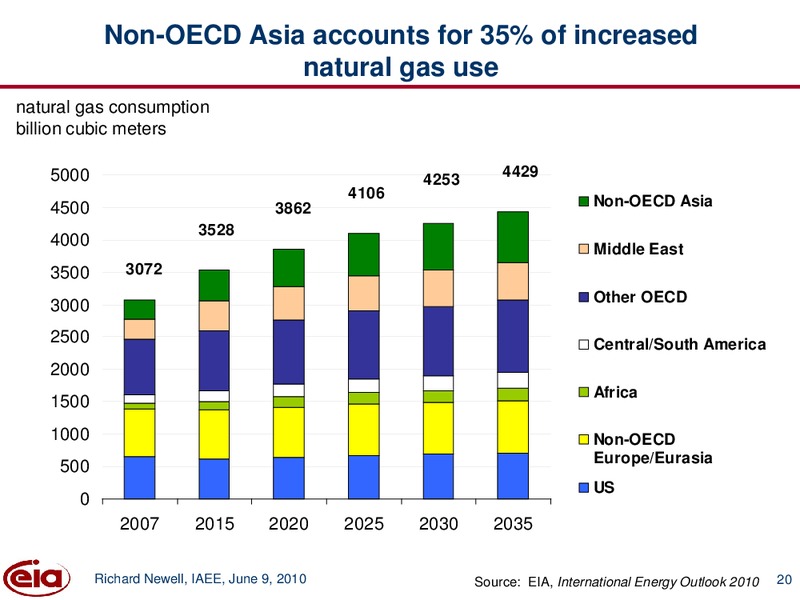
Non-OECD Asia accounts for 35% of increased natural gas use natural gas consumption billion cubic meters 5000 4429 4253 4106 4500 3862 Non-OECD Asia 3528 4000 Middle East 3500 3072 Other OECD 3000 2500 Central/South America…
The Middle East accounts for almost one-third of the increase in global gas production Percent Change 2007-2035 Other OECD -9% Australia/New Zealand 164% United States 22% Central and South America 101% Non-OECD Europe/Eurasia…
Tight gas, shale gas, and coalbed methane drive supply growth in China, Canada, and the U.S. natural gas production billion cubic meters 700 600 500 Tight gas, 400 shale gas, and coalbed methane 300 200 100 All other gas…
Coal and Electricity Richard Newell, IAEE, June 9, 2010 23
Virtually all growth in global coal use occurs in non-OECD Asian nations, especially China and India world coal consumption quadrillion Btu 160 History Projections 140 120 Non-OECD Asia 100 80 60 40 Rest of the world 20…
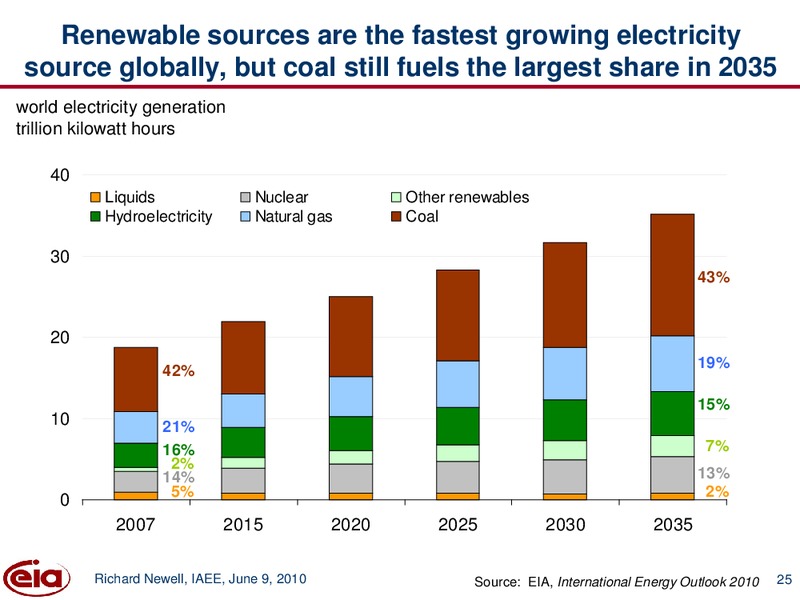
Renewable sources are the fastest growing electricity source globally, but coal still fuels the largest share in 2035 world electricity generation trillion kilowatt hours 40 Liquids Nuclear Other renewables Hydroelectricity Natural…
Summary of Key Trends Richard Newell, IAEE, June 9, 2010 26
Key trends from 2007 to 2035 in IEO2010 Reference case Global marketed energy consumption grows by 49% most growth occurs in non-OECD Asia and the Middle East world liquids demand grows 30% or 25.8 million barrels per day oil prices…
For more information U.S. Energy Information Administration home page www.eia.gov Short-Term Energy Outlook www.eia.gov/emeu/steo/pub/contents.html Annual Energy Outlook www.eia.gov/oiaf/aeo/index.html International Energy Outlook…
 Loading...