The Energy Outlook and Climate Change The Business Council, Fall Meeting October 15, 2009, Cary, NC Richard Newell, Administrator U.S. Energy Information Administration Richard Newell, The Business Council , October 2009 1
Overview Global energy outlook U.S. energy outlook EIAs analysis of HR 2454, the American Clean Energy and Security Act (ACESA) Richard Newell, The Business Council , October 2009 2
The Global Energy Outlook Richard Newell, The Business Council , October 2009 3
Non-OECD countries account for 82% of the increase in global energy use to 2030 800 OECD Non-OECD 678 700 637 596 600 552 508 59% Quadrillion Btu 500 472 400 49% 300 200 51% 41% 100 0 2006 2010 2015 2020 2025…
Renewables are the fastest growing energy source (but from a relatively small base) 250 Projections History 32% Liquids (including biofuels) 200 28% 36% Q u a d rillio n B tu 23% 150 Coal 27% Natural Gas Share of World…
Growth in worldwide economic activity, and population growth in some regions, drives increased energy use 6.5 Population 5.5 GDP per Capita 4.5 Energy Use per GDP 3.5 Percent per Year 2.5 1.5 0.5 -0.5 -1.5 US ia…
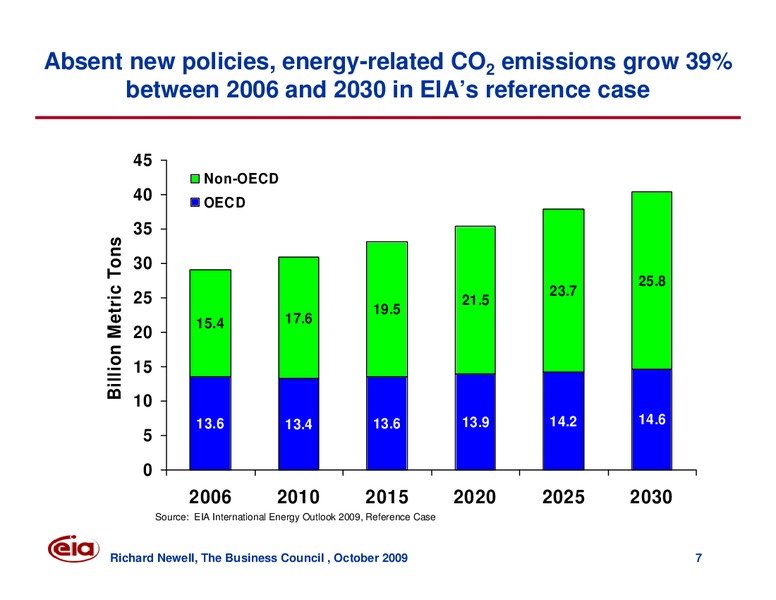
Absent new policies, energy-related CO2 emissions grow 39% between 2006 and 2030 in EIAs reference case 45 Non-OECD 40 OECD 35 Billion Metric Tons 30 25.8 23.7 25 21.5 19.5 15.4 17.6 20 15 10 13.6 13.4 13.6 13.9 14.2…
The U.S. Energy Outlook Richard Newell, The Business Council , October 2009 8
Non-fossil energy grows rapidly, but fossil fuels still provide 78% of energy use in 2030 in EIAs Reference Case quadrillion Btu 50 History Projections 40 Liquid Fuels 30 Coal 20 Natural gas Renewables (excl liquid…
Energy use per dollar of GDP continues to decline; per capita energy use also declines index, 1990=1.0 1.2 History Projections 1.0 Per capita 0.8 0.6 Per dollar 0.4 0.2 0.0 1990 2000 2010 2020 2030 Source: EIA Annual…
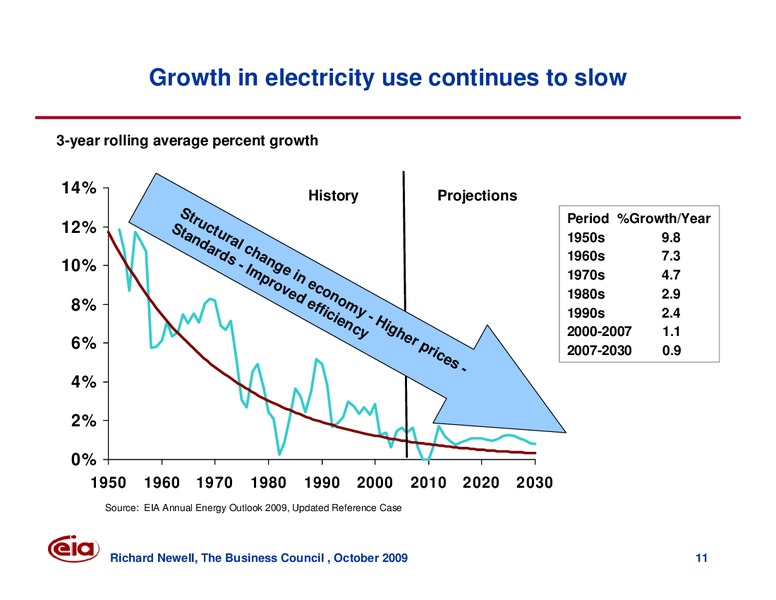
Growth in electricity use continues to slow 3-year rolling average percent growth 14% History Projections Str Period %Growth/Year 12% Sta uctu nd r a l 1950s 9.8 ard ch s - ang 1960s 7.3 10% Im e i 1970s 4.7 pro n e ve con 1980s…
Generation mix gradually shifts to lower carbon options billion kilowatthours 2,500 History Projections Coal 2,000 1,500 1,000 Natural gas Nuclear 500 Renewable Oil & Other 0 1990 2000 2010 2020 2030 Source: EIA…
Growth in energy-related CO2 emissions slows with slower growth in energy use and a shift to less carbon-intensive fuels billion metric tons 7 History Projections 6 5 4 3 2 1 0 1980 1990 2000 2010 2020 2030 Source: EIA…
EIA Analysis of HR 2454 The American Clean Energy and Security Act (ACESA) Richard Newell, The Business Council , October 2009 14
ACESA requires 24.6- billion-metric-ton reduction in covered GHG emissions over 2012-2030; actual reductions could be smaller or larger depending on the use of offsets and banking behavior CO2-equivalent emissions, billion metric tons…
Main cases in EIAs analysis Case Name Assumptions Integrated analysis of all of the modeled provisions of Basic ACESA. Same as Basic but no carryover of allowances beyond Zero Bank 2030. Proxy for major low- no-carbon energy…
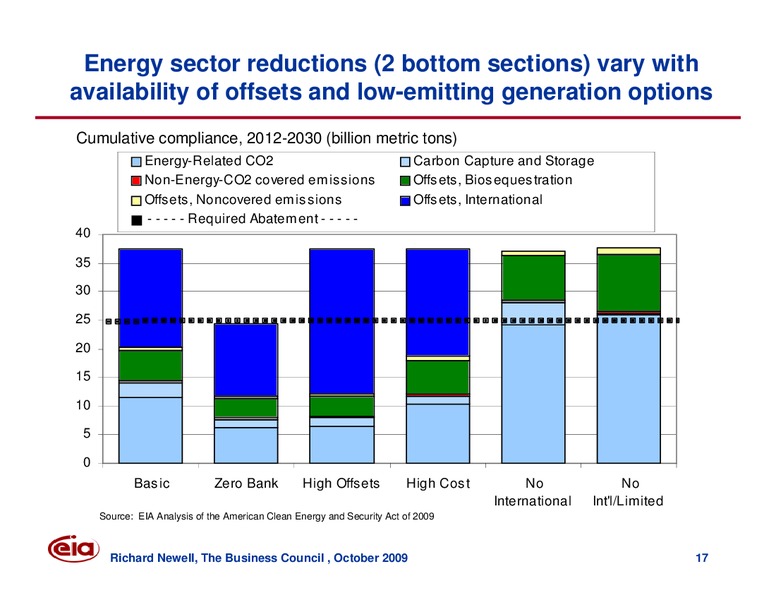
Energy sector reductions (2 bottom sections) vary with availability of offsets and low-emitting generation options Cumulative compliance, 2012-2030 (billion metric tons) Energy-Related CO2 Carbon Capture and Storage Non-Energy-CO2…
Projected allowance prices depend on the availability of offsets and low/no carbon electricity generation technologies (2007 dollars per metric ton CO2-equivalent) 200 Basic Zero Bank High Offsets 180 High Cost No International No…
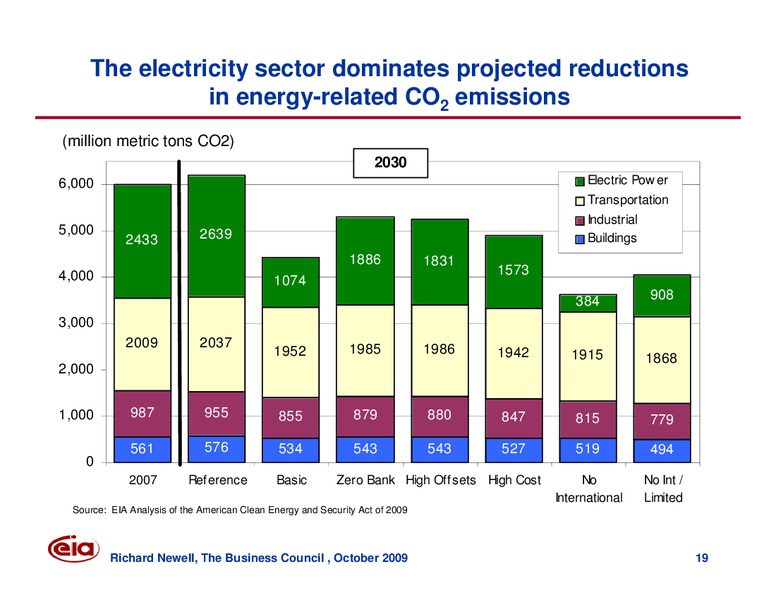
The electricity sector dominates projected reductions in energy-related CO2 emissions (million metric tons CO2) 2030 6,000 Electric Pow er Transportation Industrial 5,000 2639 2433 Buildings 1886 1831 4,000 1573 1074 384 908…
Generation by 2030 shifts from conventional coal to nuclear, renewables, and fossil+CCS, though natural gas use grows dramatically if other options are limited (billion kilowatthours) Coal Coal w /CCS Oil Natural Gas Natural Gas w…
Efficiency programs and higher electricity prices reduce electricity demand growth Annual percent growth in electricity use 3.0% 2.5% 2.39% 2.0% 2007 to 2030 Growth 1.5% 1.0% 1.15% 0.90% 0.5% 0.64% 0.72% 0.72% 0.57% 0.56%…
Electricity prices stay near baseline through 2025 in all but one case, then rise to higher levels through 2030 (2007 cents per kilowatthour, all sectors average) 20 18 16 14 12 10 8 6 Reference Basic Zero Bank 4 High Offsets…
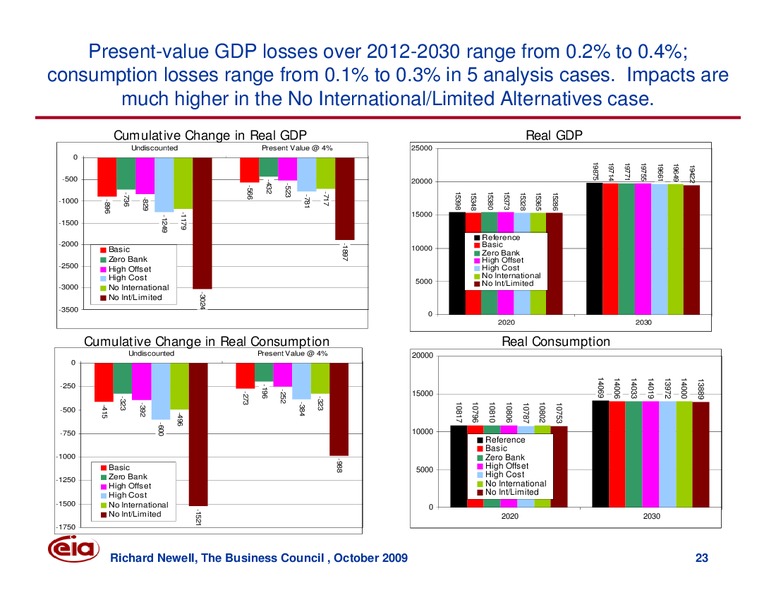
Present-value GDP losses over 2012-2030 range from 0.2% to 0.4%; consumption losses range from 0.1% to 0.3% in 5 analysis cases. Impacts are much higher in the No International/Limited Alternatives case. Cumulative Change in Real GDP…
For more information U.S. Energy Information Administration home page www.eia.doe.gov Short-Term Energy Outlook www.eia.doe.gov/emeu/steo/pub/contents.html Annual Energy Outlook www.eia.doe.gov/oiaf/aeo/index.html International…
 Loading...