Energy Efficiency in the U.S. Energy Outlook MIT-NESCAUM Endicott House August 25, 2010 Boston, MA Richard Newell, Administrator
Overview The U.S. Energy Outlook Vehicle fuel economy in the Energy Outlook Residential and commercial energy efficiency in the Energy Outlook Concluding remarks Richard G. Newell, MIT-NESCAUM, 8/25/2010 2
Global energy consumption grows 49% and non-OECD countries account for 86% of the increase through 2035 energy consumption quadrillion Btu 800 739 Non-OECD 687 OECD 639 590 600 543 495 62% 400 50% 200 50% 38% 0 2007…
The U.S. Energy Outlook Richard G. Newell, MIT-NESCAUM, 8/25/2010 4
Non-fossil U.S. energy use grows rapidly, but fossil fuels still provide 78 percent of total energy use in 2035 K-L quadrillion Btu Basic History Projections Case 120 Renewables (excluding liquid biofuels) 100 Liquid biofuels 80…
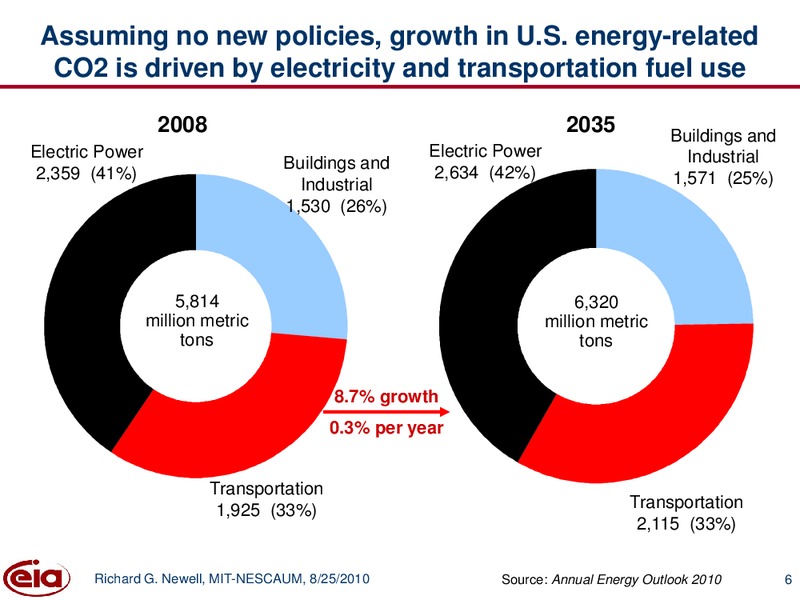
Assuming no new policies, growth in U.S. energy-related CO2 is driven by electricity and transportation fuel use 2008 2035 Buildings and Electric Power Electric Power Industrial Buildings and 2,359 (41%) 2,634 (42%) 1,571 (25%)…
Key concepts Energy efficiency energy services provided per unit of energy consumption (e.g., MPG) driven by technology improvements Energy intensity of the economy primary energy consumption per unit of real GDP inverse of…
U.S. energy and CO2 per dollar GDP continue to decline; per capita energy use also declines index, 2005=1 History Projections 1.75 1.50 1.25 1.00 Energy per capita 0.75 Energy per dollar GDP 0.50 CO2 per dollar GDP…
Examples of structural changes Buildings migration to moderate climates housing type shifts / commercial building mix Industry shifts to less energy-intensive industries growth of service sector relative to industry…
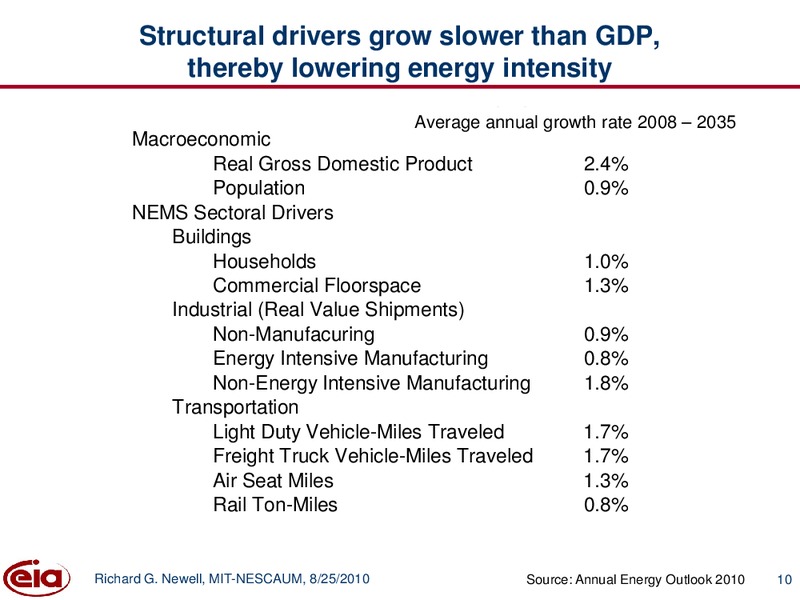
Structural drivers grow slower than GDP, thereby lowering energy intensity CAGR:growth Average annual 2008rate - 2035 2008 2035 Macroeconomic Real Gross Domestic Product 2.4% Population 0.9% NEMS Sectoral Drivers Buildings…
Energy consumption would be 16% higher in 2035 without efficiency improvements; and 68% higher without structural change as well quadrillion Btu 200 192.0 Constant energy intensity estimate Structural 150 Constant energy efficiency…
Key drivers of energy efficiency changes in EIA analysis Market drivers energy prices technology costs and innovation consumer and investor behavior technology diffusion and stock turnover Government standards vehicle fuel…
Extended policies case illustrates the impact of continued efficiency standard increases under existing laws quadrillion Btu 120 110 100 No Sunset Extended Policies Reference 90 80 2005 2010 2015 2020 2025 2030…
Vehicle fuel economy in the U.S. Energy Outlook Richard G. Newell, MIT-NESCAUM, 8/25/2010 14
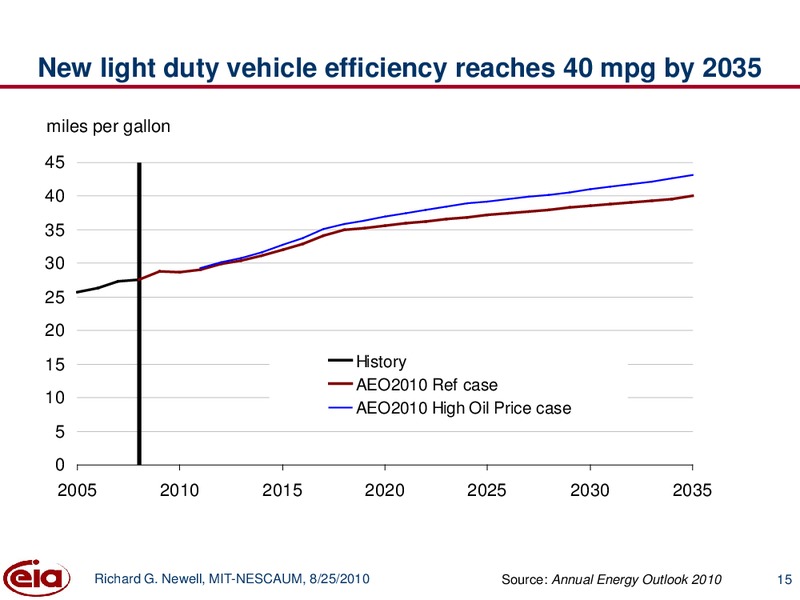
New light duty vehicle efficiency reaches 40 mpg by 2035 miles per gallon 45 40 35 30 25 20 15 History AEO2010 Ref case 10 AEO2010 High Oil Price case 5 0 2005 2010 2015 2020 2025 2030 2035 Richard G. Newell, MIT-NESCAUM,…
The continuation of existing policies into the future would increase light-duty vehicle fuel economy miles per gallon 50 Extended Policies case 45 40 35 Reference case 30 25 20 15 2005 2010 2015 2020 2025 2030 2035…
Alternative vehicle technologies meet half of light-duty vehicle sales in 2035 millions 20 History Projections 18 16 14 Conventional gasoline 12 Diesel 10 Gaseous (CNG) 8 Mild hybrid electric 6 Hybrid electric 4 Plug-in…
Market penetration of new technologies for light-duty vehicles, 2008 and 2035 2008 2035 Drag reduction Material substitution Aggressive shift logic Turbocharging Advanced transmission Camless valve activation Accessory…
Residential and commercial energy efficiency in the U.S. Energy Outlook Richard G. Newell, MIT-NESCAUM, 8/25/2010 19
Growth in electricity use continues to slow 3-year rolling average percent growth Period Annual Growth History 1950s 9.8 14 1960s 7.3 1970s 4.7 12 1980s 2.9 1990s 2.4 10 2000-2008 0.9 2008-2035 1.0 8 Projections 6 4 2 0…
Alternative building energy efficiency cases Low technology case equipment and shells limited to what was available in 2009 no technology advance, but equipment stocks improve through turnover Reference case future technology…
But buildings growth and new residential uses could more than offset efficiency improvements Change in residential electricity consumption in the Reference case, 2008-2035 Lighting PCs and related equipment Laundry and dishwashing…
Stock turnover and new technology will drive down building energy use per square foot AEO 2010 Best Available Low Technology Reference High Technology Technology 0% -5% -10% -15% -20% -25% -30% -35% -40% -45% Percent…
Growth in residential electricity sales is substantially cut by extending policies for: cooling, hot water, and refrigeration 2008 Reference: 2035 Extended Policies: 2035 Cooling Hot Water Refrigerator Freezer…
Concluding remarks Market uptake tends to be considerably less efficient than best available technology market behavior and slow stock turnover tends to moderate the impact of new innovations Analysis cases illustrate a range of…
For more information U.S. Energy Information Administration home page www.eia.gov Short-Term Energy Outlook www.eia.gov/emeu/steo/pub/contents.html Annual Energy Outlook www.eia.gov/oiaf/aeo/index.html International Energy Outlook…
 Loading...