The Outlook for Energy Markets Guy Caruso, Administrator Energy Information Administration Fraser Institute Washington Policy Briefing June 27, 2008
Oil market fundamentals are driving the 5-year run-up in prices World oil markets have become increasingly tight since 2003. Global demand growth, fed by worldwide economic growth, has exceeded non-OPEC supply growth. OPEC and…
Oil prices have increase by almost 300 percent since January 2003 Prior to 2000, oil prices were relatively stable and well below 30 per barrel. Starting in 2003, oil prices began climbing due to inventory tightening, increasing…
Despite higher prices, world oil demand growth is strong Since 2003, world oil consumption has growth has averaged 1.8 percent per year. Non-OECD countries, especially China, India, and the Middle East, represent the largest part of…
while overall non-OPEC supply growth has slowed in recent years In the past 3 years, non-OPEC supply growth has been well below levels seen just 4 years ago. Russia drove non-OPEC supply growth during the first part of the decade;…
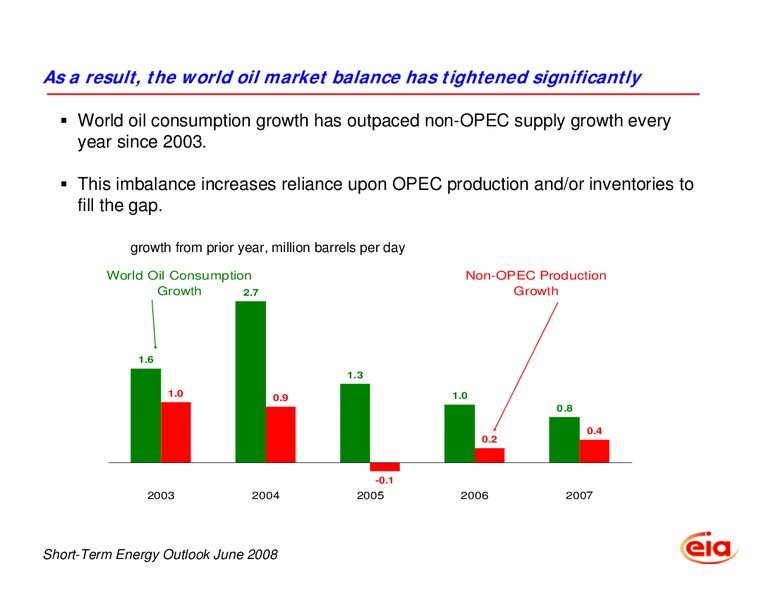
As a result, the world oil market balance has tightened significantly World oil consumption growth has outpaced non-OPEC supply growth every year since 2003. This imbalance increases reliance upon OPEC production and/or inventories…
World surplus production capacity remains low, leaving world oil markets vulnerable to supply disruptions Current world surplus production capacity is below historic levels. In addition, it is highly concentrated in a few countries,…
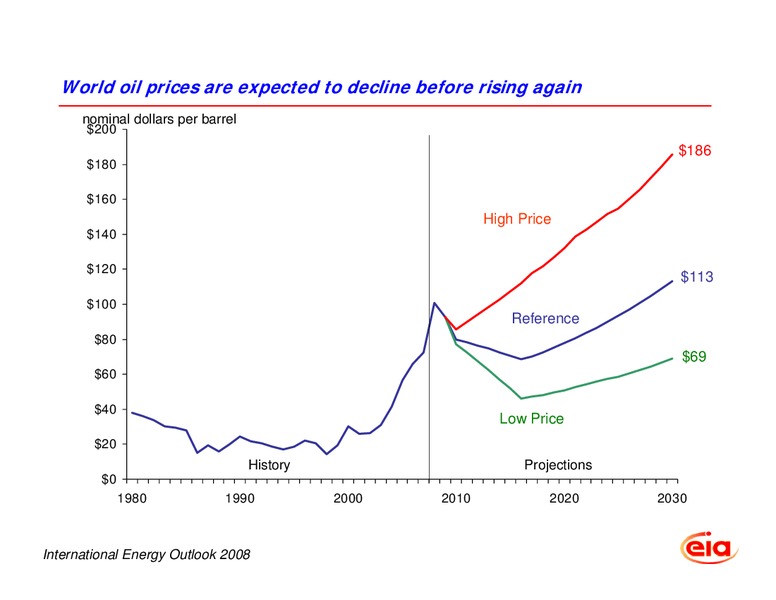
World oil prices are expected to decline before rising again nominal dollars per barrel 200 186 180 160 High Price 140 120 113 100 Reference 80 69 60 40 Low Price 20 History Projections 0 1980 1990 2000 2010 2020…
World marketed energy use in the non-OECD will soon surpass that of the OECD quadrillion Btu 450 History Projections 409 400 350 Non-OECD 286 300 241 250 OECD 200 221 150 100 50 0 1980 1985 1990 1995 2000 2005 2010…
Fossil fuels will continue to dominate world energy use quadrillion Btu 250 History Projections 33% Liquids 29% 200 37% Natural Gas Coal 24% 150 27% 100 Share of 23% World Total Renewables 8% 50 8% 6% 6% Nuclear…
Unconventional liquids will increase as a share of world production millions of barrels of oil equivalent per day 120 Total 113 100 80 60 55 Non-OPEC Conventional 48 40 OPEC Conventional 20 Unconventional 10 0 1990…
U.S. energy prices are expected to decline in the near term, then rise 2006 dollars per million Btu 35 History Projections 30 Electricity 25 20 15 Crude Oil 10 Natural Gas 5 Coal 0 1980 1990 2000 2005 2010 2020 2030…
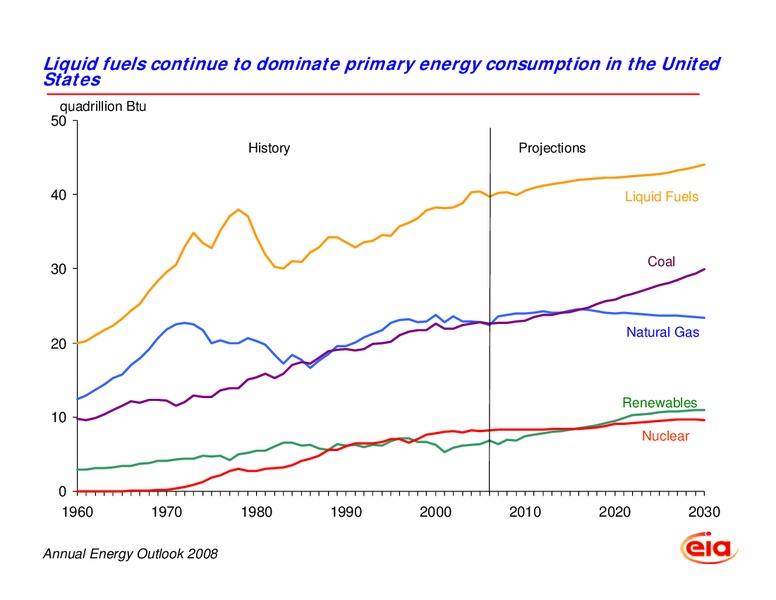
Liquid fuels continue to dominate primary energy consumption in the United States quadrillion Btu 50 History Projections 40 Liquid Fuels Coal 30 Natural Gas 20 Renewables 10 Nuclear 0 1960 1970 1980 1990 2000…
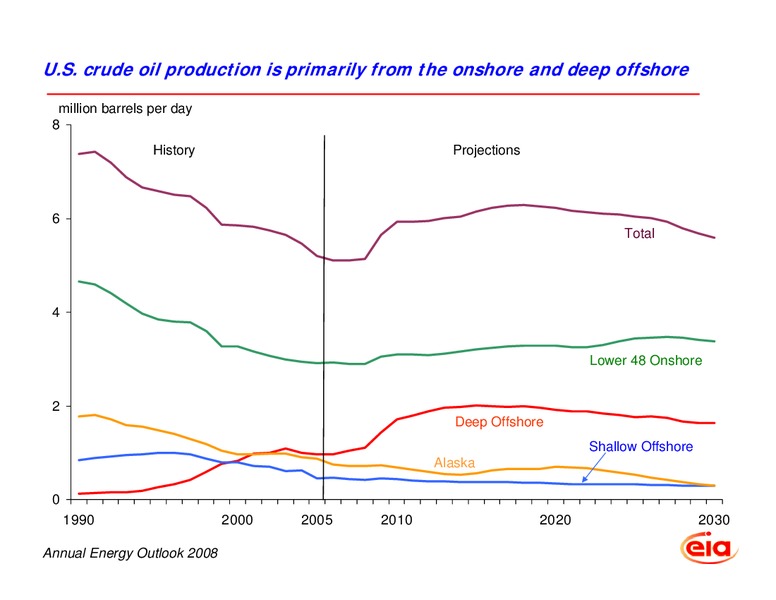
U.S. crude oil production is primarily from the onshore and deep offshore million barrels per day 8 History Projections 6 Total 4 Lower 48 Onshore 2 Deep Offshore Shallow Offshore Alaska 0 1990 2000 2005 2010…
U.S. dependence on imports of liquid fuels and other petroleum declines by 2030 million barrels per day 25 History Projections 20 Consumption Net Imports 54% 15 60% 10 Domestic Supply 5 0 1960 1970 1980 1990 2000…
U.S. dependence on natural gas net imports declines slightly trillion cubic feet 30 History Projections 25 Consumption Net Imports 14% 20 16% Production 15 Natural Gas Net Imports, 2006 and 2030 4 2.9 2006 10 3 2030…
Unconventional natural gas production will account for nearly half of U.S. supply trillion cubic feet 10 History Projections Lower 48 Non-Associated Unconventional 8 6 Lower 48 Non-Associated Offshore Lower 48 Non-Associated…
Periodic Reports Petroleum Status and Natural Gas Storage Reports, weekly Short-Term Energy Outlook, monthly Annual Energy Outlook 2008, March 2008, full report, June 2008 International Energy Outlook 2008, June 2008, full report, July…
 Loading...