Effects of low oil prices Energy & Environmental Markets Advisory Committee Commodity Futures Trading Commission February 26, 2015 Washington, DC By: Adam Sieminski U.S. Energy Information Administration U.S. Energy…
Historical and projected oil prices Crude oil price price per barrel (real 2010 dollars) 140 120 Prices shown are quarterly averages: dashed lines are EIA projections 100 80 60 40 20 0 1970 1974 1978 1982 1986 1990 1994 1998…
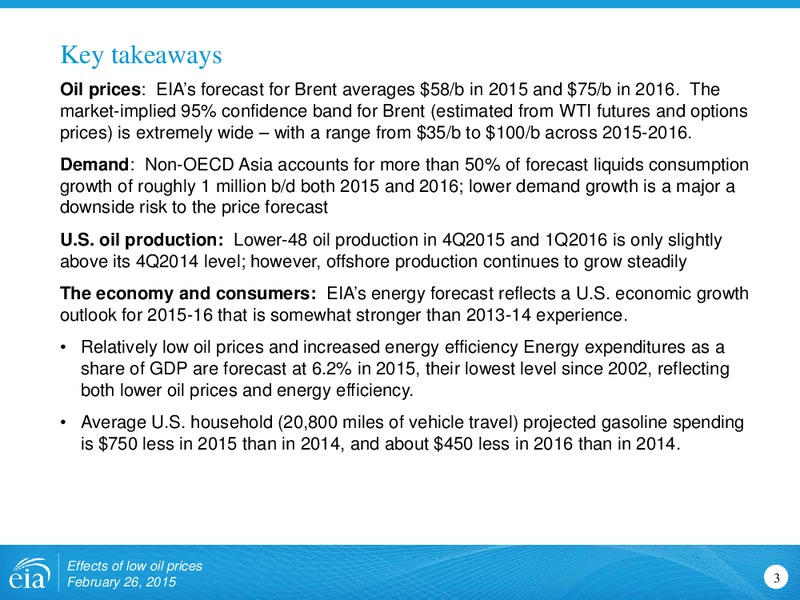
Key takeaways Oil prices: EIAs forecast for Brent averages 58/b in 2015 and 75/b in 2016. The market-implied 95% confidence band for Brent (estimated from WTI futures and options prices) is extremely wide with a range from 35/b to 100/b…
Brent crude oil prices were relatively stable through the first half of 2014; increased oil supply and lower global economic growth expectations lowered prices from July 2014 to January 2015 dollars per barrel Stable demand and Potential…
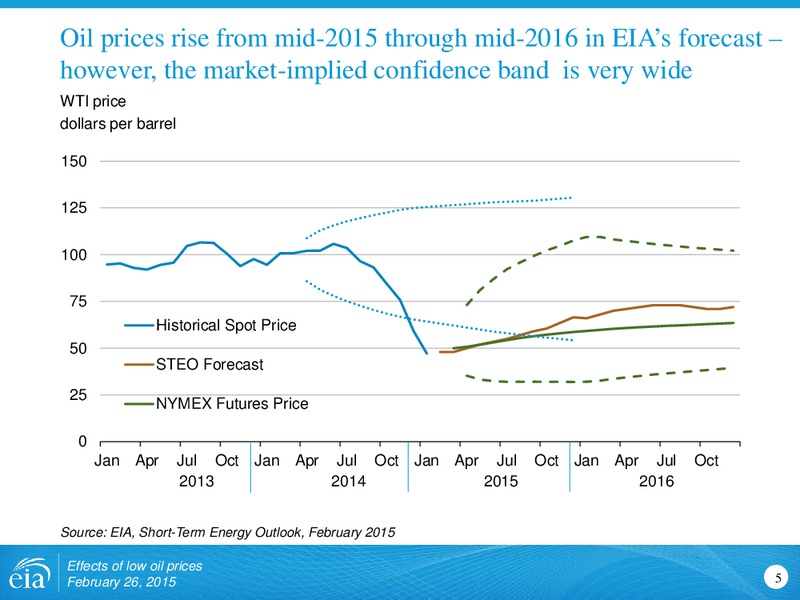
Oil prices rise from mid-2015 through mid-2016 in EIAs forecast however, the market-implied confidence band is very wide WTI price dollars per barrel 150 125 100 75 Historical Spot Price 50 STEO Forecast 25 NYMEX Futures…
EIA forecast oil price path is similar to trajectory of 2008-10 price recovery (just a comparison, not a factor in developing the forecast) Brent crude oil price dollars per barrel 140 2008-10 120 2014-16 100 Forecast 80 60 40…
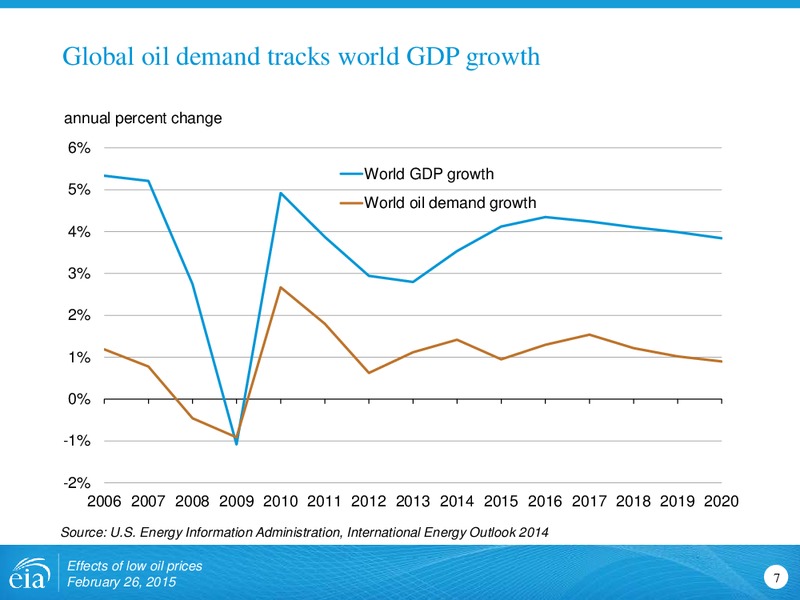
Global oil demand tracks world GDP growth annual percent change 6% World GDP growth 5% World oil demand growth 4% 3% 2% 1% 0% -1% -2% 2006 2007 2008 2009 2010 2011 2012 2013 2014 2015 2016 2017 2018 2019 2020 Source: U.S.…
Global liquids consumption growth is forecast at 1.0 million bbl/d in both 2015 and 2016 World liquid fuels consumption annual change million barrels per day million barrels per day 96 Change in U.S. consumption (right axis) 8 Forecast…
North American oil production growth slows with lower oil prices but remains the main driver of global production growth World crude oil and liquid fuels production growth million barrels per day 2.0 Forecast 1.5 1.0 0.5 0.0 -0.5…
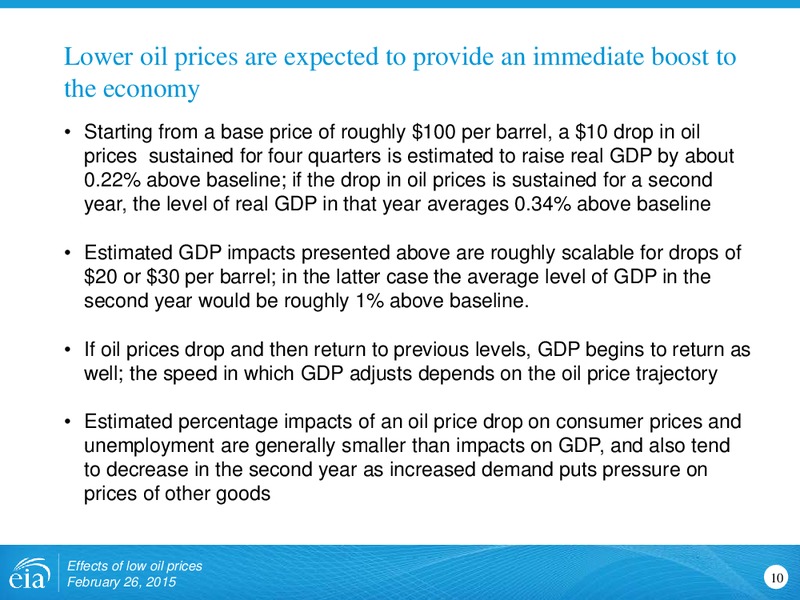
Lower oil prices are expected to provide an immediate boost to the economy Starting from a base price of roughly 100 per barrel, a 10 drop in oil prices sustained for four quarters is estimated to raise real GDP by about 0.22% above…
Average household energy expenditures fall by 17% in 2015, then rebound somewhat in 2016 (based on EIA price forecast) household energy expenditures dollars 5,000 4,568 4,534 3,750 4,086 393 416 4,000 403 392 1,422 1,464 Natural…
Various events could lead to changes in global supply or demand that could push future crude oil prices higher or lower than the STEO forecast Event Social unrest in Venezuela leads to supply disruptions ISIL disrupts Iraqi exports…
For more information U.S. Energy Information Administration home page www.eia.gov Annual Energy Outlook www.eia.gov/aeo Short-Term Energy Outlook www.eia.gov/steo International Energy Outlook www.eia.gov/ieo Monthly Energy Review…
 Loading...