North American Energy Outlook XXI World Energy Congress Session: North America energy and climate change policies September 13, 2010 Montreal, Canada Richard G. Newell, Administrator
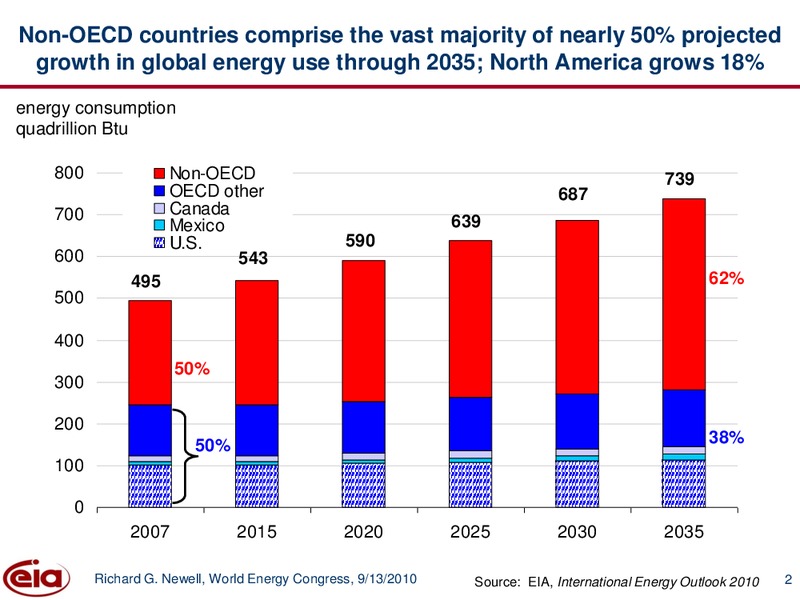
Non-OECD countries comprise the vast majority of nearly 50% projected growth in global energy use through 2035; North America grows 18% energy consumption quadrillion Btu 800 Non-OECD 739 OECD other 687 700 Canada Mexico 639 U.S.…
North American energy consumption shifts toward more renewables and less petroleum Canada United States Mexico Renewables Liquids 1% 1%7% 6% 8% 5% 29% 32% 40% 14 102 8 22% 54% 2007 Quads Quads Quads 33% 7% Nuclear 11% 21%…
Economic and population growth drive increases in energy use; energy intensity improvements moderate this trend average annual change (2007-2035) percent per year Population GDP per capita Energy use per GDP Energy CO2 per energy…
Assuming no policy changes, global energy-related CO2 emissions grow 43% from 2007 to 2035 energy CO2 emissions billion metric tons 45 Non-OECD 42 OECD other 39 40 Canada Mexico 36 35 U.S. 34 30 32 67% 30 25 53% 20 15…
North America imports 1/3 of its liquids consumption; Canada and Mexico supply 1/3 of U.S. imports (2009) million barrels per day To/From non-North…
Unconventional liquids provide the largest projected increases in North American liquids production liquids production million barrels per day 12 10 Biofuels Shale oil 8 Coal-to-liquids 6 Extra-heavy oil 4 Oil sands/…
North America imports less than 2% of its natural gas consumption; Canada exports half its production to U.S. (2009) trillion cubic feet To/From non-North America…
Tight gas, shale gas, and coalbed methane drive supply growth in Mexico, Canada, and the U.S. natural gas production trillion cubic feet billion cubic meters 25 708 20 566 Tight gas, shale gas, and coalbed methane 15 425 10…
Canada exports 9% of its electricity generation to U.S.; however, net U.S. imports are less than 1% of consumption (2008) billion kilowatthours 55.7 23.5 0.6 1.3 Richard G. Newell, World Energy Congress, 9/13/2010…
For more information U.S. Energy Information Administration home page www.eia.gov Short-Term Energy Outlook www.eia.gov/emeu/steo/pub/contents.html Annual Energy Outlook www.eia.gov/oiaf/aeo/index.html International Energy Outlook…
Global energy consumption 2007 2035 Renewables Liquids Nuclear 10% 14% 5% 6% 30% 35% Coal 495 739 27% Quads Quads 28% 22% 23% Natural gas Richard G. Newell, World Energy Congress, 9/13/2010 Source: EIA, International…
Energy consumption shifts to more renewables and less petroleum Canada United States Mexico Renewables Liquids 6% 1%7% 8% 5% 29% 32% 41% 14 102 8 22% 54% 2007 Quads Quads Quads 33% 7% Nuclear 11% 21% 23% Coal Natural gas…
Liquids production changes in Mexico, Canada, and the U.S. liquids production million barrels per day 12 Biofuels 10 Shale oil 8 Coal-to-liquids Extra-heavy oil 6 Oil sands/ bitumen 4 Refinery gain NGL 2 Crude/condensate…
 Loading...