Second Quarter 2015 Investor Review Presented August 5, 2015 1
Summary of Q2 Results Q2 revenue was a record 936.2 million, up 9% from prior year with emergency response (ER) events driving the increase Q2 Adjusted EBITDA* of 163.1 million, an increase of 20%; Adjusted EBITDA margin of 17.4%, up…
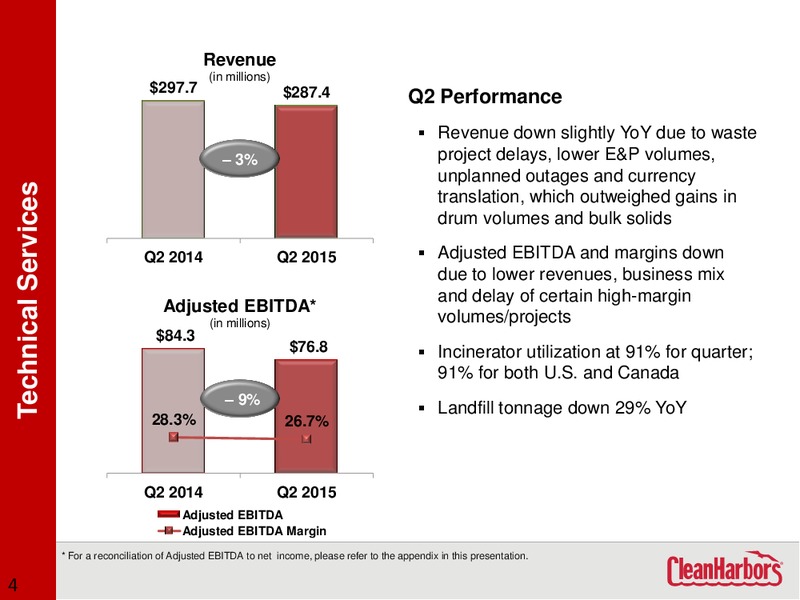
Revenue (in millions) 297.7 287.4 Q2 Performance Revenue down slightly YoY due to waste 3% project delays, lower E&P volumes, unplanned outages and currency Technical Services translation, which outweighed gains in drum…
Revenue (in millions) 341.7 Q2 Performance Revenue increased substantially due to Industrial and Field Services 174.1 ER events, as well as growth in a number + 96% of our specialty industrial services related to U.S. turnaround…
Outside Revenue (in millions) 144.0 99.1 Q2 Performance 31% Oil Re-refining and Recycling Outside revenue down 31% YoY due to Q2 2014 Q2 2015 lower base oil and blended pricing; direct revenue also down due to pricing Direct…
Outside Revenue (in millions) 171.3 175.9 Q2 Performance + 3% Outside revenue up slightly as addition of TFI SK Environmental Services and increase in base business offset Q2 2014 Q2 2015 decrease in S-K RFO revenue Direct…
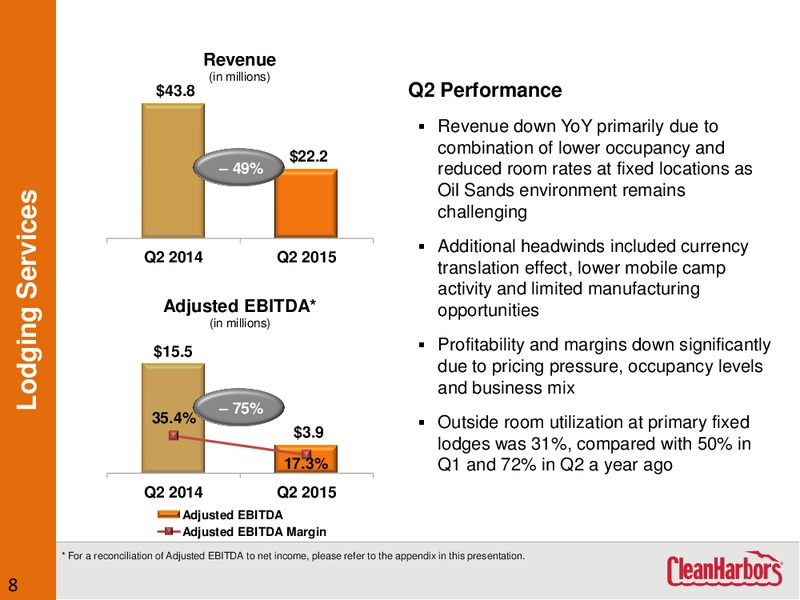
Revenue (in millions) 43.8 Q2 Performance Revenue down YoY primarily due to 22.2 combination of lower occupancy and 49% reduced room rates at fixed locations as Oil Sands environment remains Lodging Services challenging…
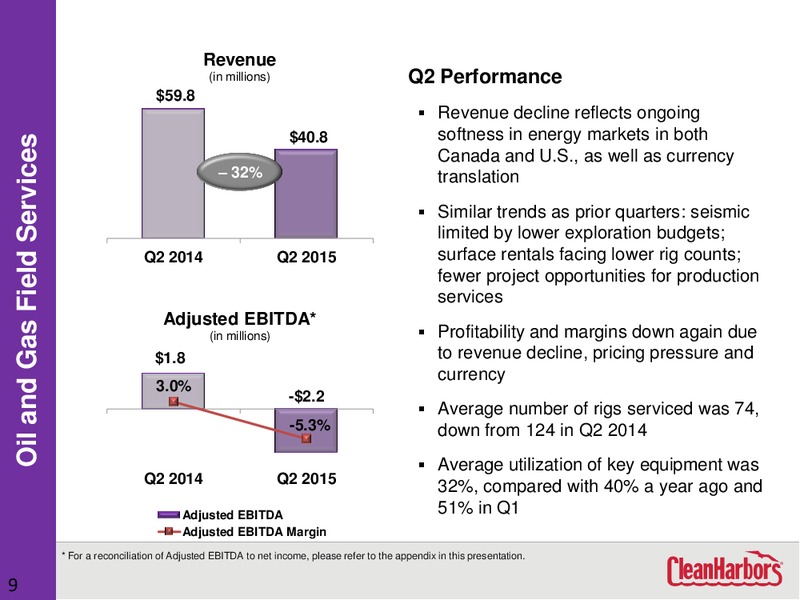
Revenue (in millions) Q2 Performance 59.8 Revenue decline reflects ongoing 40.8 softness in energy markets in both Oil and Gas Field Services Canada and U.S., as well as currency 32% translation Similar trends as prior…
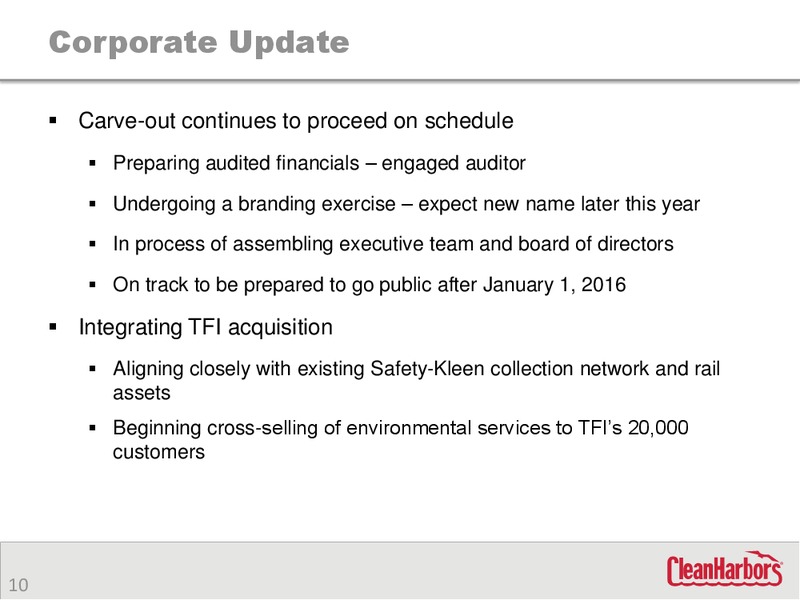
Corporate Update Carve-out continues to proceed on schedule Preparing audited financials engaged auditor Undergoing a branding exercise expect new name later this year In process of assembling executive team and board of…
Capital Allocation Strategy Three key elements: Organic Growth Share Acquisitions Investments Repurchases Mix will be determined on a relative basis by: performance, price, risk, opportunity and cost of capital Will deploy…
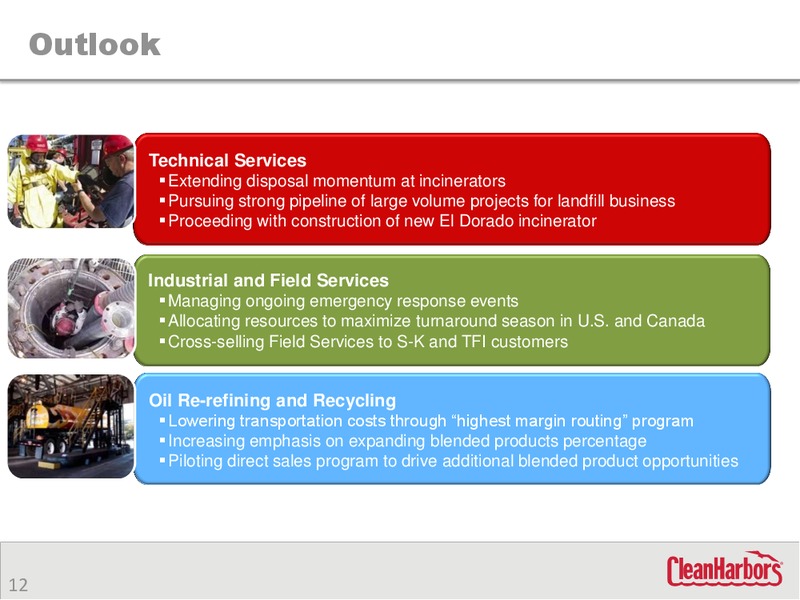
Outlook Technical Services Extending disposal momentum at incinerators Pursuing strong pipeline of large volume projects for landfill business Proceeding with construction of new El Dorado incinerator Industrial and Field…
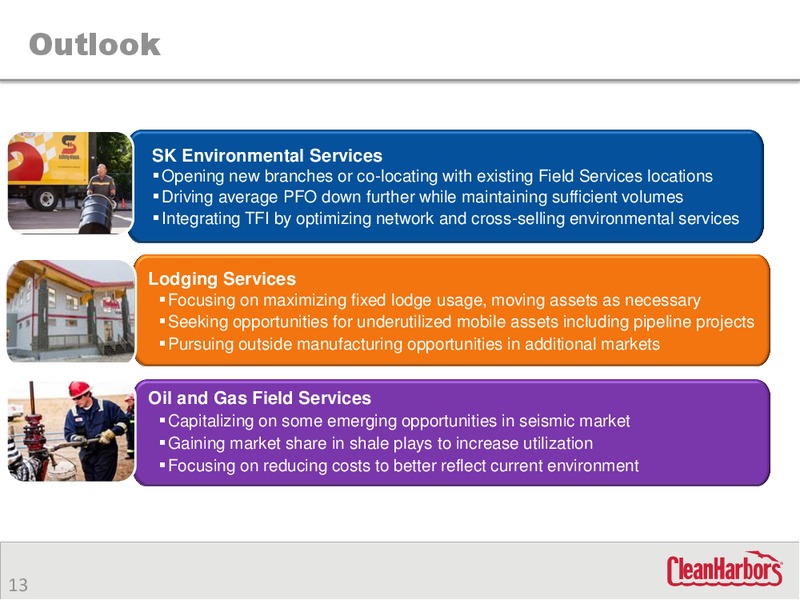
Outlook SK Environmental Services Opening new branches or co-locating with existing Field Services locations Driving average PFO down further while maintaining sufficient volumes Integrating TFI by optimizing network and…
Financial Review 14
Reporting Segments Q2 Direct Revenue (In millions) Technical Services Oil and Gas 31% Field Services 4% Lodging Services 287.4 40.8 2% 22.2 SK Environmental 167.1 Services 341.7 18% 77.7 Industrial and Field Services…
Q2 Income Statement (In millions, except per share data) Q2 2015 Q2 2014 Revenue 936.2 858.5 Cost of revenues 652.7 607.0 Gross profit 283.5 251.5 Gross margin % 30.3% 29.3% Selling, general and administrative expenses 120.4…
Balance Sheet and Cash Flow Highlights (In millions) 6/30/15 3/31/15 12/31/14 Balance Sheet Highlights Cash and cash equivalents 173.6 233.7 246.9 Accounts payable 365.1 244.2 267.3 Billed and unbilled receivables 722.0 554.9…
Guidance (as of August 5, 2015) Q3 2015 Range Adjusted EBITDA* (in millions) 165 170 2015 Range Adjusted EBITDA* (in millions) 530 570 * For a reconciliation of Adjusted EBITDA to net income, please refer to the appendix…
Questions & Answers 19
Appendix 20
Non-GAAP Reconciliation For the Three Months Ended: For the Six Months Ended: (in thousands) June 30, June 30, June 30, June 30, 2015 2014 2015 2014 Net income 10,395 28,672 3,306 37,632 Accretion of environmental liabilities…
Non-GAAP Reconciliation For the Three Months Ended: For the Six Months Ended: (in thousands except per share amounts) June 30, June 30, June 30, June 30, 2015 2014 2015 2014 Adjusted income from operations Income from operations…
Non-GAAP Reconciliation For the Quarter Ending For the Year Ending September 30, 2015 December 31, 2015 Amount Amount (In millions) (In millions) Projected GAAP net income 42 to 48 64 to 95 Adjustments: Accretion of…
 Loading...