Who We Are Largest and Most Complex(1) Refiner in Niche Hawaii Market Crude capacity of 94,000 barrels per day Integrated Refiner and Marketer 50% distillate yield configuration Flexibility to utilize a wide range of crude…
Company Timeline 9/1/2012: 6/17/2013: 11/14/2013: 7/22/2014: 2/20/2015: 5/15/2015: Delta Petroleum Agreed to HIE Retail entered Moved from Texadian HIE Retail emerged from purchase Kapolei into a credit OTCQB amendment of amendment to…
Hawaii Refinery Overview Asset Highlights Largest and most complex refinery in Hawaii Nelson complexity of 5.7 High-margin distillate yield configured for island demand Asset location and configuration well positioned to benefit…
Logistics System Overview Asset Highlights Hawaiian Assets Map (1) Integrated system enhances flexibility and profitability 30,000 Bbls North America Complementary, difficult to replicate asset base Multiple advantages from Single…
Distribution Network Overview Asset Highlights Extensive footprint across five islands Mid Pac acquisition significantly expands scale and operating capabilities Anticipated continued volume growth from increasing retail and…
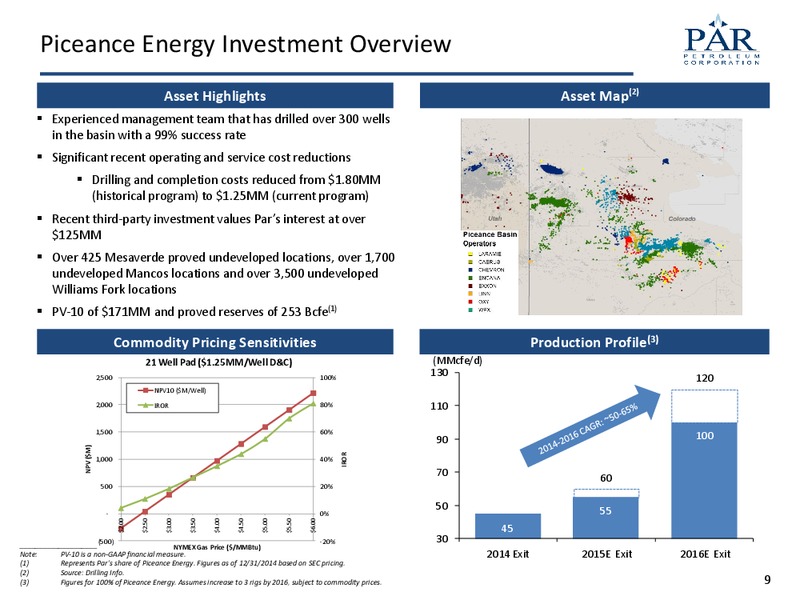
Piceance Energy Investment Overview Asset Highlights Asset Map(2) Experienced management team that has drilled over 300 wells in the basin with a 99% success rate Significant recent operating and service cost reductions Company…
Well Positioned to Benefit from Commodity Flows Waterborne Access Mid-Pacific Trends Located at the crossroads of changing crude flows Increased supply of cost advantaged crude leads to from West to East sustainable competitive…
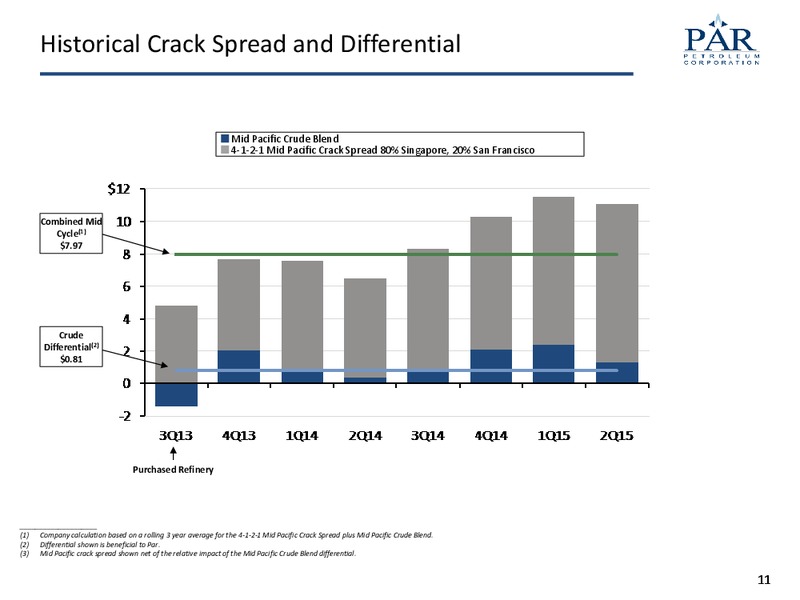
Historical Crack Spread and Differential Mid Pacific Crude Blend 4-1-2-1 Mid Pacific Crack Spread 80% Singapore, 20% San Francisco Combined Mid Cycle(1) 7.97 Crude Differential(2) 0.81 Purchased Refinery…
Leader in Niche Hawaiian Market Refined Product Demand(1) Par Refinery Yield MBbl/d 2014 Q2 2015 80 Production Capacity 70 72 64 60 59 Heavy 56 Fuel Oils 47 & Other Distillates 48 38% 38% 40 Distillate Other 50% Products 32…
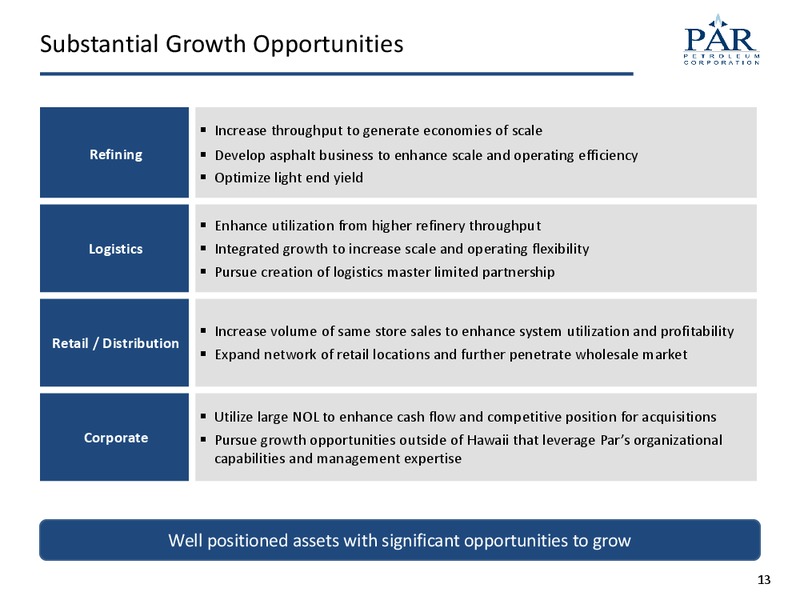
Substantial Growth Opportunities Increase throughput to generate economies of scale Refining Develop asphalt business to enhance scale and operating efficiency Optimize light end yield Enhance utilization from higher refinery…
Investment Highlights High Quality Asset Base in Niche Market Constructive Identified Market Growth Environment Opportunities Experienced Significant Management Financial Team and Board Flexibility 15
Appendix
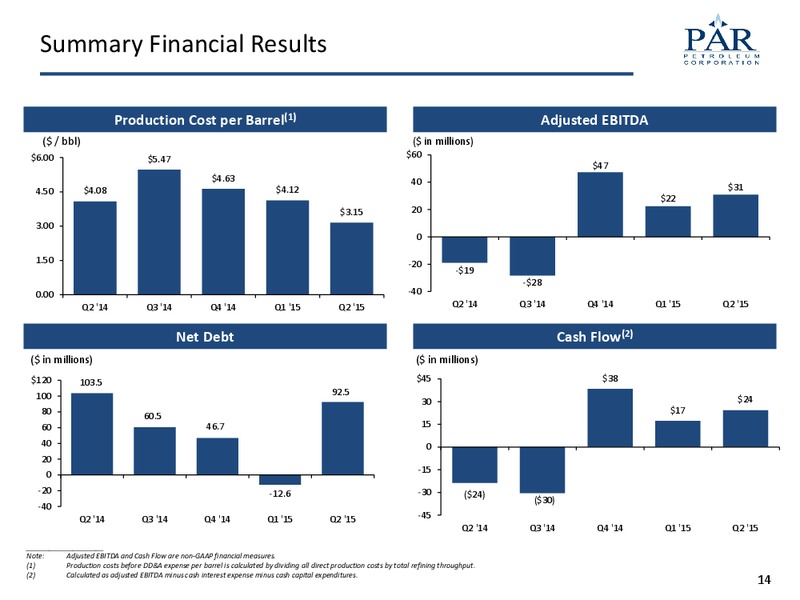
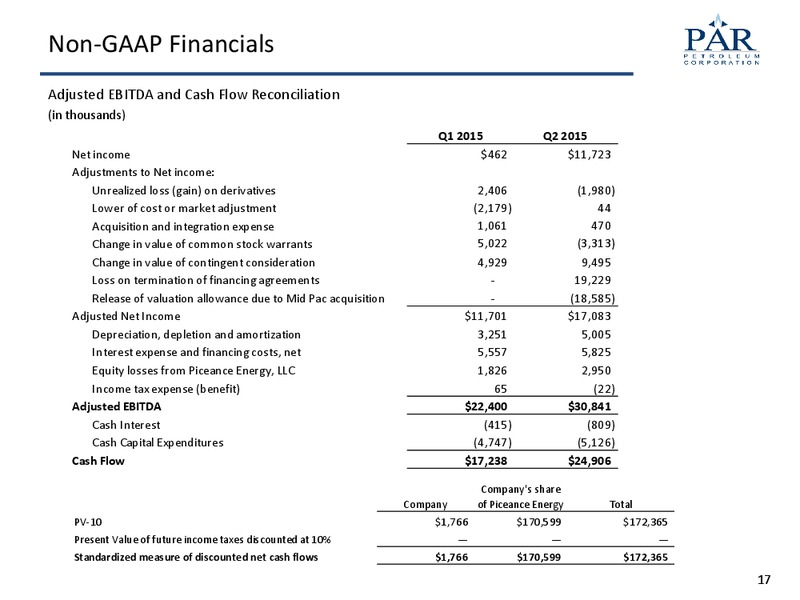
Non-GAAP Financials Adjusted EBITDA and Cash Flow Reconciliation (in thousands) Q1 2015 Q2 2015 Net income 462 11,723 Adjustments to Net income: Unrealized loss (gain) on derivatives 2,406 (1,980) Lower of cost or market adjustment…
 Loading...