Second quarter results 2015 Matti Lievonen, President & CEO 5 August 2015
Agenda 1 Q2/15 Group financials 2 January-June 2015 review 3 Q2/15 segment reviews 4 Current topics 5 Appendix 5 August 2015 2
Good second quarter Strong refining margin environment Largest turnaround in history at Porvoo refinery completed Stronger USD had positive impact on the result Guidance remains unchanged 5 August 2015 4
Gasoline margin clearly above five-year range USD/bbl 30 2014 realised 25 2015 realised 20 15 10 5 0 Jan Feb Mar Apr May Jun Jul Aug Sep Oct Nov Dec Nestes sensitivity to changes in gasoline margin per annum: +/- 1.00 USD/bbl…
Gasoline as the star of the moment Global oil demand up by approx. 1.5 mbpd compared to 2014 Demand growth largely coming from gasoline US gasoline demand has reached levels seen in 2007, and gasoline inventory levels have…
Changes in revenue Group revenue Q2/14 vs. Q2/15, billion euros 4.1 -1.1 -0.7 32 +0.3 2.6 Q2/14 Volumes Changes in oil price FX changes Q2/15 5 August 2015 9
Support from favorable market Group comparable EBIT Q2/14 vs. Q2/15, MEUR +106 -130 Additional margin: - 50 MEUR Volumes: - 80 MEUR 86 +35 -4 78 -16 +7 -6 Q2/14 Reference Porvoo Volumes Additional Fixed costs Fx changes…
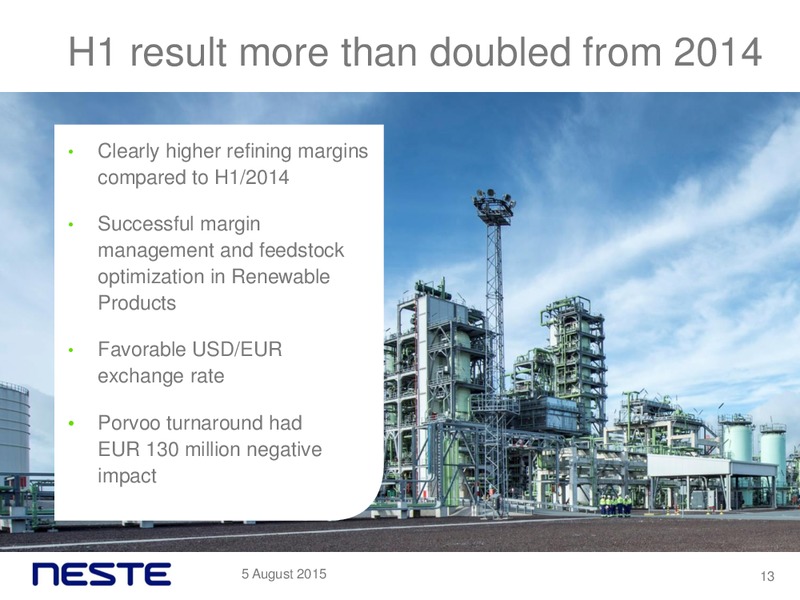
H1 result more than doubled from 2014 Clearly higher refining margins compared to H1/2014 Successful margin management and feedstock optimization in Renewable Products Favorable USD/EUR exchange rate Porvoo turnaround had…
Changes in revenue Group revenue H1/14 vs. H1/15, billion euros 7.6 -1.1 -1.9 +0.7 5.3 32 H1/14 Volume Changes in oil price Fx changes H1/15 5 August 2015 15
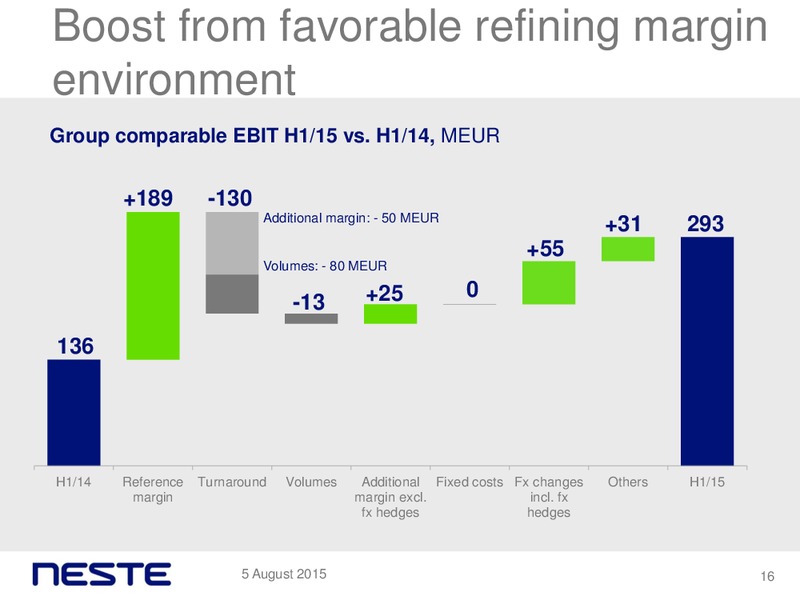
Boost from favorable refining margin environment Group comparable EBIT H1/15 vs. H1/14, MEUR +189 -130 Additional margin: - 50 MEUR +31 293 +55 Volumes: - 80 MEUR +25 0 -13 136 H1/14 Reference Turnaround Volumes Additional…
Q2/15 segment reviews
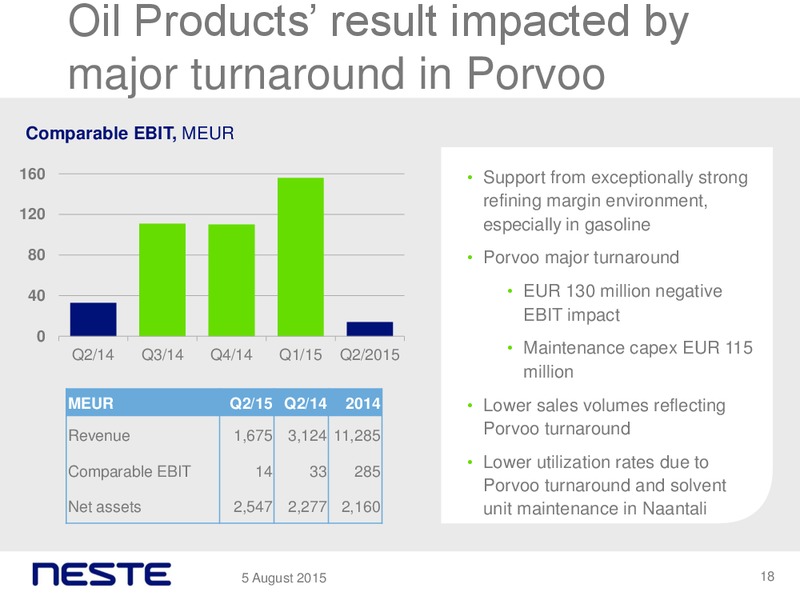
Oil Products result impacted by major turnaround in Porvoo Comparable EBIT, MEUR 160 Support from exceptionally strong refining margin environment, 120 especially in gasoline 80 Porvoo major turnaround 40 EUR 130 million negative…
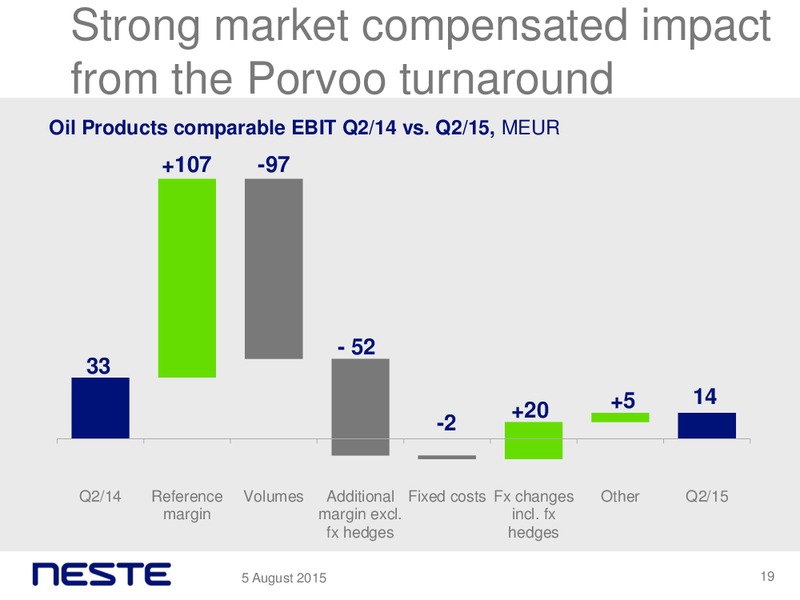
Strong market compensated impact from the Porvoo turnaround Oil Products comparable EBIT Q2/14 vs. Q2/15, MEUR +107 -97 - 52 33 +5 14 +20 -2 Q2/14 Reference Volumes Additional Fixed costs Fx changes Other Q2/15 margin…
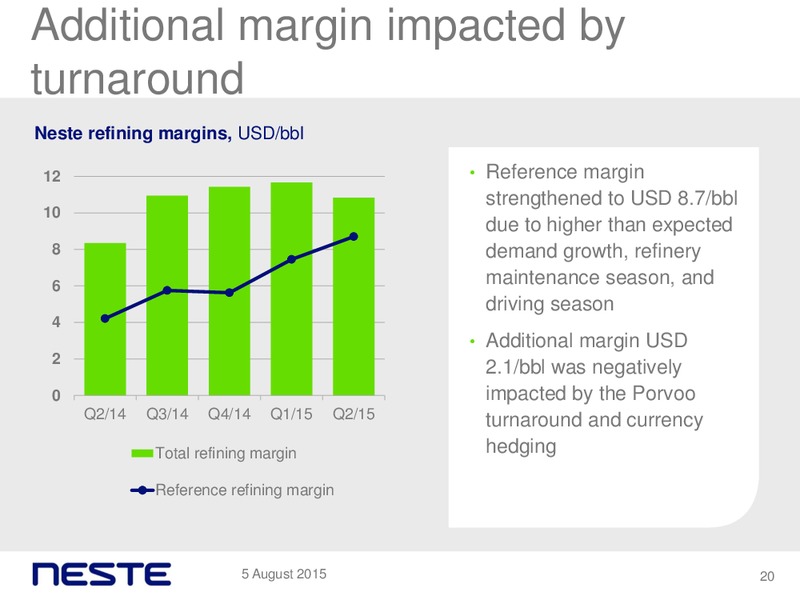
Additional margin impacted by turnaround Neste refining margins, USD/bbl 12 Reference margin strengthened to USD 8.7/bbl 10 due to higher than expected 8 demand growth, refinery 6 maintenance season, and driving season 4…
Renewable Products positive trend continued Comparable EBIT, MEUR 150 Clearly higher comparable EBIT compared to Q2/14 100 Average utilization rate 86% reflecting the Porvoo 50 turnaround 0 63% of sales to Europe and Q2/14 Q3/14…
Result supported by additional margin and stronger USD Renewable Products comparable EBIT Q2/14 vs. Q2/15, MEUR +17 0 54 +9 -2 32 -1 -1 Q2/14 Volumes Reference Additional Fixed costs Fx changes Others Q2/15 margin margin…
Additional margin remained solid Renewable Products margins, USD/ton 500 Sales margin at same level 400 compared to Q2/2014 300 Additional margin USD 168/ ton supported by successful 200 margin management and feedstock flexibility…
Signs of European margins picking up FAME RED Seasonal vs. Palm oil price* Vegetable oil and animal fat prices**, USD/ton differential, USD/ton 500 1,400 400 1,200 300 1,000 200 800 100 600 0 400 Jan-13 Jul-13 Jan-14 Jul-14…
D4 RINs stable in the US SME vs. Soybean oil price differential, USD/ton Biodiesel RIN, US cent /gal 800 150 600 100 400 50 200 0 0 Jan-13 Jul-13 Jan-14 Jul-14 Jan-15 Jul-15 Jan-13 Jul-13 Jan-14 Jul-14 Jan-15 Jul-15…
Oil Retails good performance continued Comparable EBIT, MEUR 30 Market remains competitive Volumes and margins 20 reflected by summer season 10 Volumes increased in the 0 Baltics Q2/14 Q3/14 Q4/2014 Q1/15 Q2/15 Weaker ruble had…
Result supported by increased volumes and enhanced margins Oil Retail comparable EBIT Q2/14 vs. Q2/15, MEUR +3 -2 +2 -2 +1 22 20 Q2/14 Volumes Unit margin Fixed costs Fx changes Others Q2/15 incl. fx hedges 5 August…
Current topics
Outlook Guidance remains Forward reference unchanged refining margin outlook is stronger than seen in Group's full-year 2015 April comparable EBIT estimated to remain Reintroduction of US robust and to be higher Blenders Tax…
New openings with leading brands Google chose UPS to start NEXBTL to fuel using NEXBTL in personnel shuttle its fleet operating buses in Silicon in the USA Valley, California Cooperation with Neste and Kesko Total Fluides…
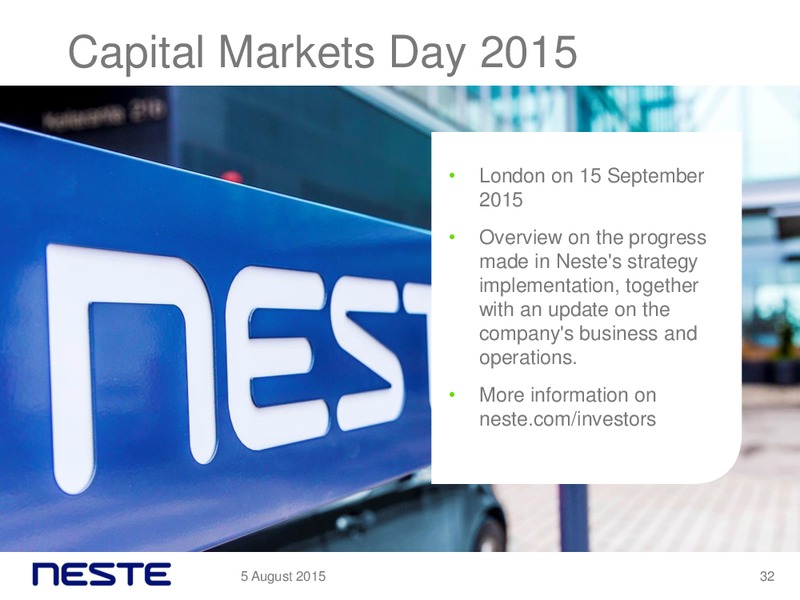
Capital Markets Day 2015 London on 15 September 2015 Overview on the progress made in Neste's strategy implementation, together with an update on the company's business and operations. More information on…
We focus on Refinery Markets and Safety Cash flow productivity customers 5 August 2015 33
Balance sheet Total assets Total equity & liabilities Non-current assets Int-bear. liabilities Equity Current assets Int-free liabilities Other 6,904 8,000 8,000 23 7,157 6,904 7,157 7,000 7,000 6,000 6,000 2,747 2,782 5,000 4,089…
Cash flow MEUR Q2/15 Q2/14 Q1/15 H1/15 H1/14 2014 EBITDA (IFRS) 146 153 311 457 284 480 Capital gains/losses 2 0 -79 -77 2 2 Other adjustments 96 12 -36 60 12 -80 Change in working capital 28 101 -367 -339 -181 -33 Net finance costs…
Liquidity & maturity profile MEUR 700 Total liquidity at the end of June 2015 was EUR 2,447 million 600 Cash and cash equivalents 500 totalled EUR 397 million Unused committed credit 400 facilities totalled EUR 1,650 million 300…
 Loading...