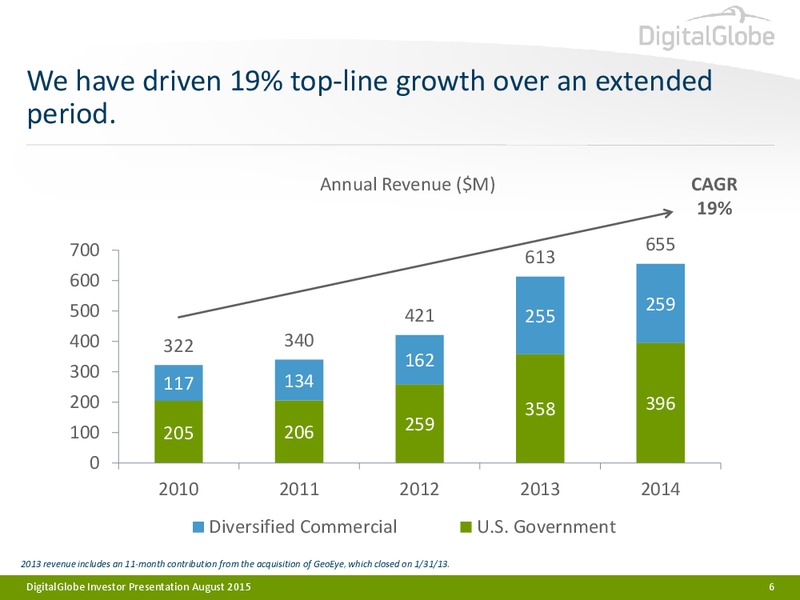
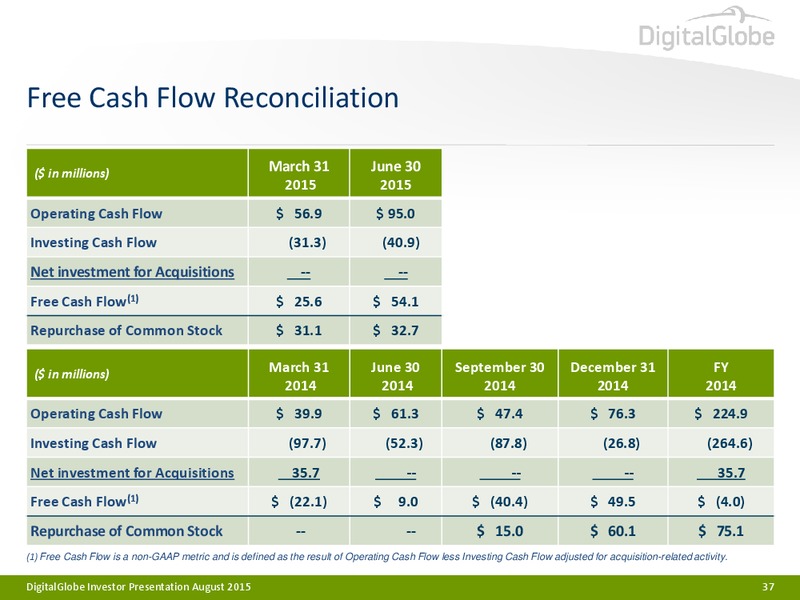
DigitalGlobe Investor Presentation August 2015 Flame Towers Baku June 2015 GeoEye-1
DigitalGlobe is a global leader in collection and distribution of earth imagery and geospatial information. Who We Are Why We Stand Out How We Build Value DigitalGlobe Investor Presentation August 2015 3
We have a track record of growth driven by a diverse set of long-term government and commercial customers. Who We Are Why We Stand Out How We Build Value Leading provider of Commercial Imagery and GeoSpatial Solutions Track…
DigitalGlobe at a glance Leading provider of commercial satellite imagery and geospatial solutions Executing on a strategy and roadmap for sustained revenue growth Sustaining a strong and growing U.S. Government business…
We have grown adjusted EBITDA 15% over an extended period. Annual Adjusted EBITDA (M) Generated CAGR 15% 300 250 200 150 286 100 210 230 166 145 50 0 2010 2011 2012 2013 2014 2013 revenue includes an 11-month contribution…
We have long-term customer relationships with a diverse set of government and commercial customers. Customer Category Percent of TTM Revenue U.S. Government 63% International Defense & Intelligence 18% Location-based Services…
By remaining focused on four strategic areas of growth, we have delivered against all our key metrics. Focus Areas Performance Against Key Metrics Grow our Diversified ( in millions) Q2-2015 YoY Growth Commercial business Revenue…
Our unique business model and industry leading technology position us well against our competitors. Who We Are Why We Stand Out How We Build Value Two-pronged strategy for value creation Deeply embedded in our customers…
Our strategy will drive profitable growth. Our Vision: Grow Our Core Satellite Imagery By 2020, be the Business indispensable source of information about our Grow Emerging changing planet. Information and Insight Businesses…
We are evolving beyond imagery for long-term growth. Customer Workflow (Data) Imagery Information Insight Base-level imagery Higher-value finished Analytic software products products and feature and expert analysis databases…
We have many competitors, but with our sources of advantage, we continue to win against them. Competitor Our Advantages Satellite Deep customer relationships imagery Industry-best imaging technology providers Where aerial is…
We have developed new capabilities and deepened relationships in each of our vertical markets. Customer Vertical Recent Key Accomplishments U.S. Government Delivering contracted WorldView-3 imagery International Multiple Direct…
We have a path to growth in all of our Diversified Commercial customer verticals. Customer Vertical Growth Drivers International New DAP customers, and additional WorldView-3 access Defense & Intel. to existing customers…
Our most consistent and largest revenue stream has driven a significant portion of our long-term growth. Annual Revenue from U.S. Government EnhancedView SLA (M) CAGR 350 22% 300 250 200 337 150 227 255 100 201 150 157 50…
Our disruptive business model has thrived in an environment of U.S. defense budget declines. DigitalGlobe U.S. Government Revenue (M) U.S. Government Department of Defense Budget (B) 450 700 400 680 350 660 300 640 250 620 200 600…
Our satellite constellation is unequaled in its ability to uniquely address a variety of customer needs. Launched: 1999 Launched: 2001 Launched: 2007 Launched: 2008 Launched: 2009 Launched: 2014 Decommissioned: 2015 Decommissioned:…
Our constellation leads our satellite competitors by a large margin across all key parameters that drive quality. Clarity: 5x better Revisit: 4x more often Accuracy: 2x better DGI Best competitor DGI Best competitor DGI Best…
Our superior resolution is unmatched by competitors. Closest Satellite Competitor DigitalGlobe .70 m Resolution .30 m Resolution Customer Impact: Customer Impact: Many features unidentifiable Unlocks full value of image…
Our products and expertise allow us to perfectly color- match multiple source data for a clear image. Raw Image BaseMap Mosaic +Vivid Customer Impact: Clean aesthetics that attract users for our Location-Based services customers…
Our best-in-class accuracy is precise and actionable. Closest Satellite Competitor DigitalGlobe Accuracy Customer Impact: Customer Impact: Potentially devastating errors Accurate and precise actions DigitalGlobe Investor…
Our strategy and business model are building a foundation for significant value creation. Who We Are Why We Stand Out How We Build Value Well positioned for long- term growth Strong free cash flow Proven ability to acquire and…
We delivered double-digit revenue, adjusted EBITDA and free cash flow growth in Q2-15. Grew revenue 12.8% to 178.0 million Grew Adjusted EBITDA 37.2% to 87.7 million, a 49.3% margin(1) Delivered 54.1 million of Free Cash Flow, a…
We drove growth in the U.S. Government, won new business and renewed important contracts in Q2-15. Drove 18.4% growth in our U.S. Government business Grew Direct Access in part by transition to a new Constellation DAF Grew Civil…
Capital expenditures will decrease in the near term. Capital Expenditure (M) 300 250 200 150 100 50 0 2011 2012 2013 2014 2015 Integration Satellite Build Maintenance DigitalGlobe Investor Presentation August 2015 27
We recently extended the lives of our most important assets, improving capital efficiency. Satellite 07 08 09 10 11 12 13 14 15 16 17 18 19 20 21 22 23 WorldView-1 24% increase in useful life announced in December 2014 2.5 years…
We have a history of accretive acquisitions and will continue to employ a disciplined approach. Disciplined M&A Criteria Recent Transactions Acquired world-class Path to winning position in assets target verticals Operating expense…
We have plenty of incremental debt capacity available given our declining leverage ratios. ( in millions) Q2-15 Sr. Secured Term Loan due 2020 537.6 Revolver Borrowing (150 available) -- Capital Leases 2.5 Sr. Unsecured Notes due…
DigitalGlobes unique business model and heritage of growth position it well for increasing value creation. Who We Are Why We Stand Out How We Build Value DigitalGlobe is a growth Our disruptive business Our improving capital…
Questions Wind Turbine Factory June 2015 WorldView-3
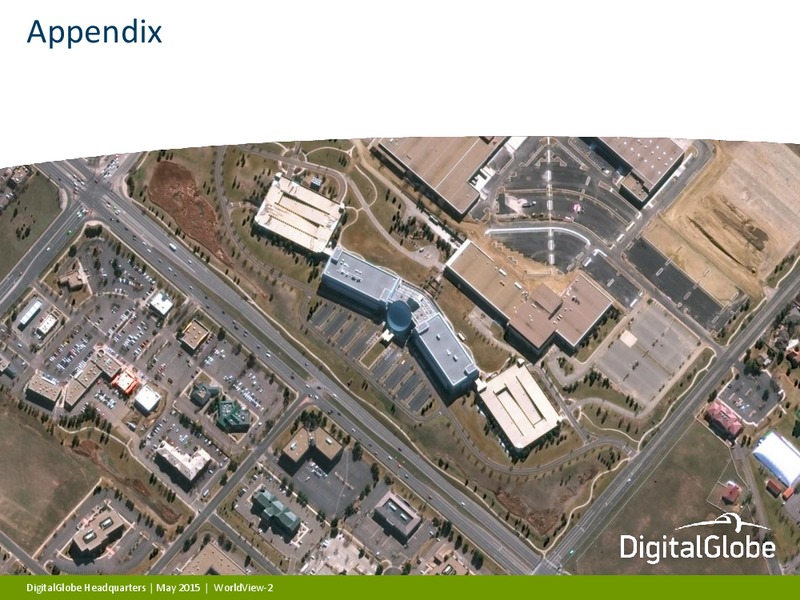
Appendix DigitalGlobe Headquarters May 2015 WorldView-2
EBITDA and Adjusted EBITDA Reconciliation ( in millions) 2010 2011 2012 2013 2014 Net income (loss) 2.5 (28.1) 39.0 (68.3) 18.5 Depreciation and amortization 118.9 117.1 114.6 224.8 238.5 Interest expense, net 40.4 21.7 9.1 3.4 7.1…
Q2 EBITDA and Adjusted EBITDA Reconciliation ( in millions) Q2-15 Q2-14 Net income 8.0 5.0 Depreciation and amortization 68.1 57.6 Interest expense, net 5.4 -- Income tax expense (benefit) 5.4 (4.3) EBITDA(1) 86.9 58.3 EBITDA…
 Loading...