A global industrial technology company focused on environmental, energy, fluid handling industries Integrated Clean Air Solutions for Industry 1
Safe Harbor Statement Important Information for Investors and Stockholders This communication does not constitute an offer to sell or the solicitation of an offer to buy securities or a solicitation of any vote or approval. This…
CECO at a Glance CECO is a leading global industrial technology company focused on critical solutions in the environmental, energy and fluid handling and filtration segments. Market Cap(2): 248 million, Net Debt: 94.6 million (as of…
Announcement of Proposed Acquisition of PMFG, Inc. - Key Transaction Benefits & Strategic Rationale 1. Strong strategic fit, environmental and energy related portfolios 2. Poised to achieve significant sales and 15 million in cost…
CECO and PMFG Technology Leaders in Comprehensive Solutions for the Natural Gas Turbine Power Market Peerless SCRs is a world Aarding Peerless Steam Emissions leader in selective Peerless Mfg. Co. catalytic Vent Control reduction…
CECO and PMFG Technology Leaders in Environmental-Industrial Silencers Design, Engineering and Manufacturing of Silencers for Full Range of Industrial Applications Integrated Clean Air Solutions for Industry 8
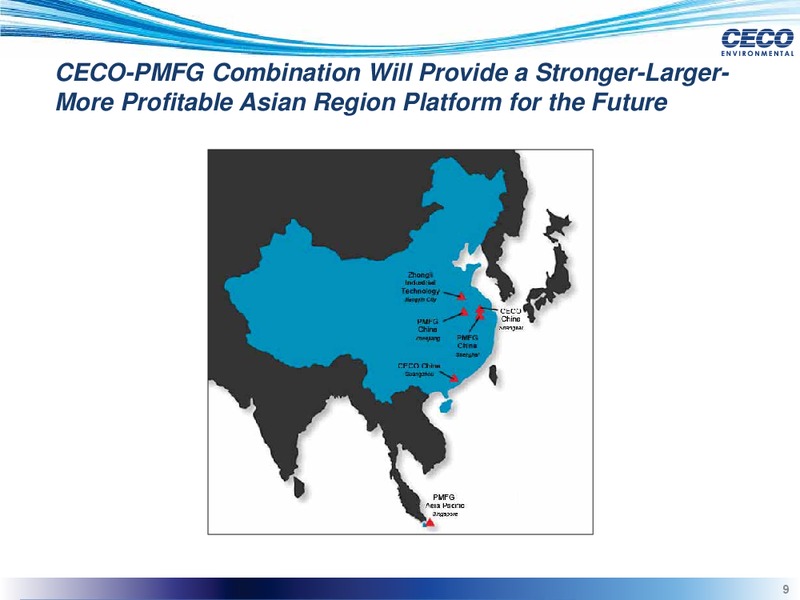
CECO-PMFG Combination Will Provide a Stronger-Larger- More Profitable Asian Region Platform for the Future Integrated Clean Air Solutions for Industry 9
Senior Leadership Jeff Lang President & Chief Executive Officer Joined CECO in February 2010 as CEO Over 30 years of industrial technology and energy related sales, operating, and management experience Former EVP, Operating Officer…
Key Investment Themes Comprehensive Portfolio of Products With Leading Technology Strong Fundamentals for Global Environmental Technologies Market Solid Brand Recognition in the Fluid Handling Market The Natural Gas Megatrend…
CECO Success Factors Sales Execute Continued Excellence Additional Investment into Driving Above Strategic Emerging Industry Acquisitions Markets Average Growth Ideal Operating Platform to Drive Future Growth Initiatives…
The Evolution of CECO CO Driving EBITDA Where We Are Going ( Millions) Legend z Organic & acquisitive growth z Focus on operational excellence Adjusted EBITDA z Maximize synergies from previous and What We Did new acquisitions %…
Integrated Clean Air Solutions for Industry 14
Business Segments: Three Core Strategic Segments Environmental Technologies Product recovery and air pollution control solutions Energy Fluid Handling/ Technologies Filtration Technologies Customized High quality…
Environmental Technologies Segment Integrated Clean Air Solutions for Industry 16
Energy Technologies Segment Integrated Clean Air Solutions for Industry 17
Fluid Handling/Filtration Technologies Segment Integrated Clean Air Solutions for Industry 18
Expanding Globally with Localized Sales and Production Capabilities North America Strong market presence Shale revolution creating opportunities in nat. gas Asia & India High growth emerging market supported by strong APC…
Industry-Leading End Markets with Balance and Diversity Large Industrial Manufacturing Water and Wastewater Chemical, Petrochemical & Refining Microelectronics and Semiconductor Industrial Ventilation Municipalities Metals,…
Leverage to Large Blue-Chip Customers Example Customers 5,000+ Customers Globally Well-Diversified Cross-Section of End-Markets No Customer, Year Over Year, Represents More Than 5% of Sales on Average Integrated Clean Air…
Well Positioned to Capitalize on Secular Trends Supported by Increasing Levels of Regulation US Domestic Markets Increasingly Stringent APC Regulatory Environment Pertinent Landmark EPA Environmental Regulations Boiler MACT Compliance…
Well Positioned to Capitalize on Secular Trends Supported by Increasing Levels of Regulation China Chinas Rapid Industrialization & Focus on Compliance 12th Five Year Plan: All coal/oil fired thermal units nationwide must comply…
Financial Overview Integrated Clean Air Solutions for Industry 2424
Financial Overview Extremely low CapEx per incremental revenues via asset light model Proven ability to improve cost structure Proven balance sheet and leverage management Focus on cash flow management Key initiatives have…
2Q15 Quarterly Financial Highlights ( in millions) Revenue Record revenue of 87 million, up 31% y/y and 8% sequentially 1H15 organic growth was up 4.5% and on a constant currency basis, organic revenue was flat for 2Q15 Gains in…
2Q15 Quarterly Financial Highlights g g ( in millions) Backlog Bookings Organic bookings are up 4.5% 1H and flat in Q2, following a very strong 1Q15 Solid 2Q15 backlog of 140.3 million 2Q15 bookings of 75 million vs 57.7…
2Q15 Financial Highlights Non-GAAP Gross Margin Non-GAAP Operating Margin Gross margin increased to 30.7% in Q2 due to mix changes, operational excellence, and aftermarket Operating margin of 14.2% in Q2 vs. 9.3% in Q1 showing…
2Q15 Quarterly Financial Highlights ( in millions) Adjusted EBITDA Non-GAAP EPS Note: See supplemental slide for adjusted EBITDA reconciliation and important disclosures regarding CECOs use of adjusted EBITDA. Adjusted EBITDA…
Environmental Segment 2nd Quarter Results ( in millions) Revenue Bookings Revenue of 41.8 million was up 27% y/y Bookings of 31.0 million in 2Q15, up 17.4% y/y Aftermarket continues to gain momentum July booking of U.S. Refinery…
Energy Segment 2nd Quarter Results ( in millions) Revenue Bookings Revenue of 27.3 million was up 62.5% y/y Revenue is up 12% sequentially Aftermarket and retrofit opportunities continue to grow The Energy segment continues to…
Fluid Handling & Filtration Segment 2nd Quarter Results ( in millions) Revenue Bookings Organic revenue of 17.7 million, up 16.4% sequentially, 6.0% y/y Organic bookings of 18.6 million, up 14.8% sequentially Margin expansion and…
Balance Sheet ( in millions) Selected Balance Sheet Information 12/31/2011 12/31/2012 12/31/2013 12/31/2014 6/30/2015 Cash & Equivalents 12.7 23.0 22.7 19.4 17.1 Total Assets 79.3 94.1 348.5 414.4 416.7 Total Bank Debt 0.0 0.0…
Supplemental Integrated Clean Air Solutions for Industry 36
 Loading...