Third-Quarter Fiscal Year 2015 August 11, 2015 Rio Olympics 2016 Masterplan, Rio de Janeiro, Brazil
Presenters Michael S. Burke Chairman Chief Executive Officer Stephen M. Kadenacy President Chief Financial Officer August 11, 2015 Page 3
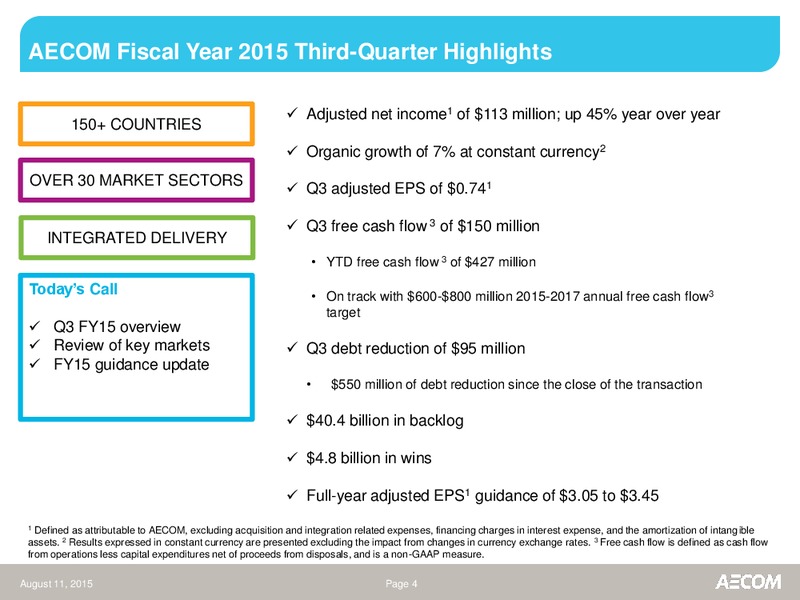
AECOM Fiscal Year 2015 Third-Quarter Highlights Adjusted net income1 of 113 million; up 45% year over year 150+ COUNTRIES Organic growth of 7% at constant currency2 OVER 30 MARKET SECTORS Q3 adjusted EPS of 0.741 Q3 free cash…
Q3 FY15 Business Highlights & Outlook Design & Consulting Services Construction Services Management Services 1.5x book-to-burn1 ratio in the YoY backlog growth of 16%; Strong project execution and Americas organic revenue growth of…
Healthy Book of Future Business & Revenue Visibility Backlog ( billions) 40.7 40.4 18.0 17.7 Q3 FY15 Highlights: 40.4 billion backlog Organic backlog growth of 2% YoY 1.1x book-to-burn ratio1; 4.8 billion in wins 20.5 driven by…
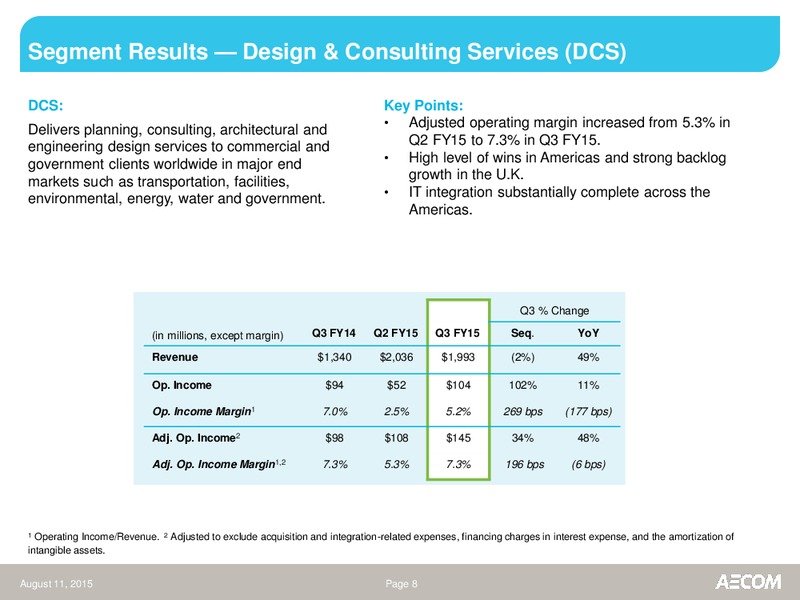
Segment Results Design & Consulting Services (DCS) DCS: Key Points: Delivers planning, consulting, architectural and Adjusted operating margin increased from 5.3% in engineering design services to commercial and Q2 FY15 to 7.3% in Q3…
Segment Results Construction Services (CS) CS: Key Points: Provides construction services for energy, Organic revenue grew 54% YoY, reflecting continued commercial, industrial, and public and private strength in private construction…
Segment Results Management Services (MS) MS: Key Points: Provides program and facilities management and Organic MS revenue declined 13% YoY due to lower maintenance, training, logistics, consulting, overseas contingency operations…
Cash Generation and Capital Allocation Highlights YTD FY15 Highlights Closed financing of URS transaction. Generated 427 million of FCF1. Repaid over 550 million in debt subsequent to closing the URS transaction in October.…
Fiscal 2015 Outlook Adjusted EPS1 guidance of 3.05 to 3.45 Prior EPS guidance modified due to lower estimates of non-cash normal profit. Operating performance consistent with prior outlook. The net impact of normal margin is now…
AECOM: A Leading Global Engineering and Construction Services Company 1 global design firm1 with top rankings in key end markets: Facilities; Transportation; Environmental; and Power & Energy. Geographic footprint, services…
Appendix: Reconciliation for Amortization, Acquisition & Integration Expenses August 11, 2015 Page 14
Appendix: Reconciliation for Amortization, Acquisition & Integration Expenses August 11, 2015 Page 15
Appendix: Diversified Geographies, End Markets, Funding Sources and Contract Types Funding Sources Non-U.S. Government 12% Private U.S. 14% State/Local End Markets 50% Geographies Federal/ Support Services Canada…
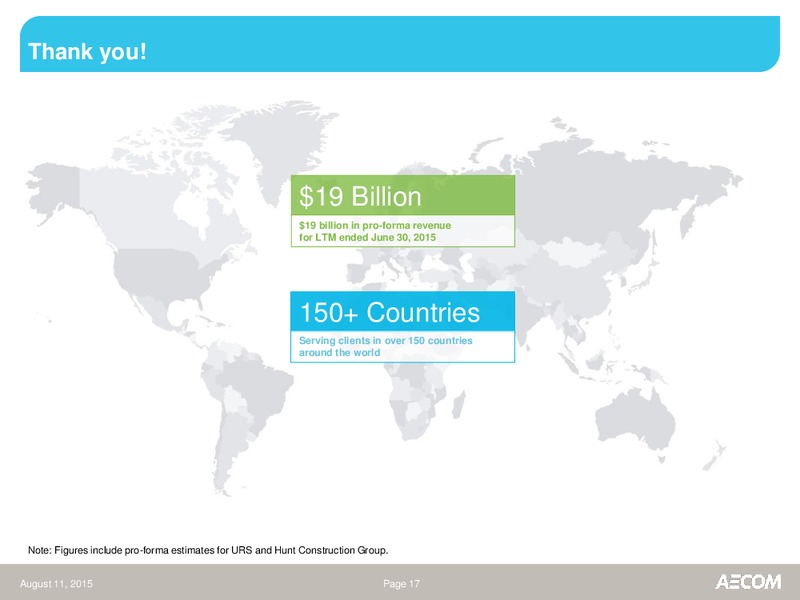
Thank you 19 Billion 19 billion in pro-forma revenue for LTM ended June 30, 2015 150+ Countries Serving clients in over 150 countries around the world Note: Figures include pro-forma estimates for URS and Hunt…
 Loading...