2Q 2015 IFRS FINANCIAL AND OPERATING RESULTS August 13, 2015, Saint-Petersburg
Agenda Highlights, Alexey Yankevich Financials Member of the Management Board, CFO Upstream Alexander Miheev Head of Economics and Investment Department, Exploration and Production Division Downstream Vladimir Konstantinov…
Highlights 1H 2015 Financial Performance: Sales: RUB 803 bln (-1.4% Y-o-Y) EBITDA*: RUB 200 bln (+12.0% Y-o-Y) Net Income: RUB 112 bln (+28.3% Y-o-Y) Operational Progress in 1H 2015 : Hydrocarbon production up 20.5% Y-o-Y…
Exploration and Production Consistent major projects execution and steady production levels at legacy fields Gazprom neft 5
Delivering on 2015 growth plans Major achievements in 1H15: Plans for 2015: Legacy fields Achieve 10% Group hydrocarbon production growth Y-o-Y Increased hydrocarbon production 19.4% Y-o-Y (MMtoe) Begin production at…
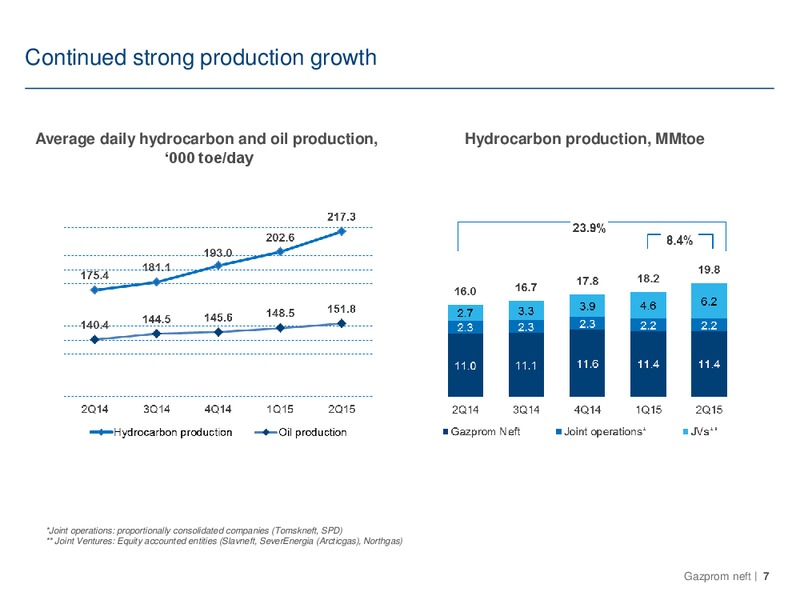
Continued strong production growth Average daily hydrocarbon and oil production, Hydrocarbon production, MMtoe 000 toe/day *Joint operations: proportionally consolidated companies (Tomskneft, SPD) ** Joint Ventures: Equity…
Major projects and acquisitions have driven hydrocarbon production growth Hydrocarbon production 1H15 to 1H14, MMtoe 19.4% Liquid hydrocarbon +1.82 MMTonnes Gas +4.35 MMtoe *JVs refer to proportionally consolidated and…
The Y-o-Y increase in unit operating costs due to reserves depletion Brownfield OPEX reconciliation, RUB/toe +6% +2% 1,472 1,395 1,364 +16% REVEX +3% Lifting costs Note: The chart above takes into account the…
Industrial implementation of HiWay* hydrofracking technology Description of technology: Benefits Conducting hydraulic fracturing with Reduces risk of accidents from 5% to less than 1% Reduces development costs up to 10% per well (due…
New field developments continue to move forward Finished construction of one cuttings disposal SeverEnergia Began production from Yaro- Prirazlomnoye and one production wells Yakhinskoye, third SeverEnergia Launched reservoir pressure…
Refinery modernization continues to progress as premium sales rise Major achievements in 1H 2015: Plans for 2015: Refining Increased condensate processing at Omsk to 0.6 MMTonnes (+ 0.4 to 1H14) Moscow: Active construction phase of…
Refining operations optimized for current economic and price environment Crude price and average netbacks, /bbl Crude mix, MMTonnes 14.94 120 +5.3% 14.18 Brent 2.05 Crude export 1.67 +22.8% 100 -7.5% 1.96 Crude to CIS & 2.12…
Gazprom Neft increasing light product sales volumes and market share Volumes supplied to domestic Company share of total Y-o-Y changes in market market, MTonnes volumes volumes in Russia 1H15 22% Gasoline 4,441 +1 pp +3.4% + 0.1%…
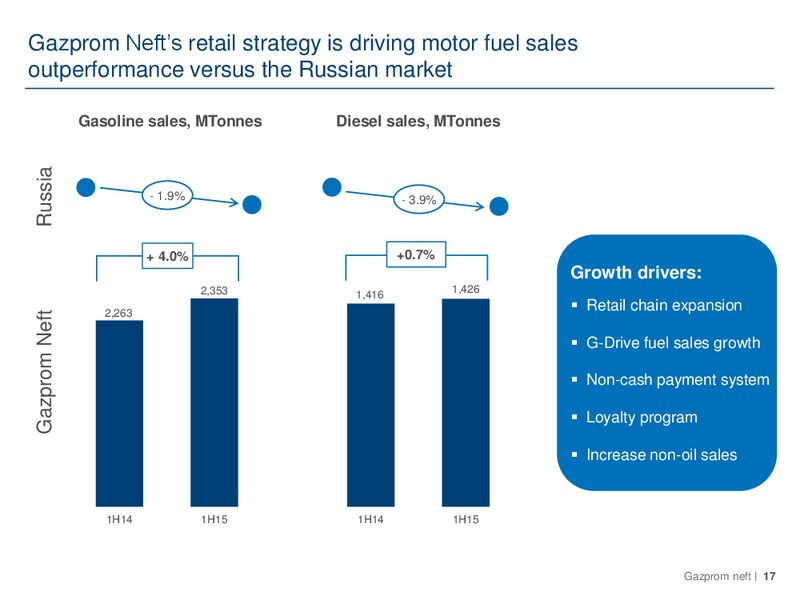
Gazprom Nefts retail strategy is driving motor fuel sales outperformance versus the Russian market Gasoline sales, MTonnes Diesel sales, MTonnes Russia - 1.9% - 3.9% + 4.0% +0.7% Growth drivers: 2,353 1,426 1,416 2,263…
Domestic and global expansion via premium channels Growth in premium sales Average throughput of Russian service stations reached 1H15 vs. 1H14 18.7 tonnes/day in 2Q15 Increased network size to 1,832 as of 2Q 2014 Increased revenue…
Financials Continued growth and operational performance drive higher Y-o-Y EBITDA and net income Gazprom neft 19
Increased production and premium sales driving Y-o-Y revenue, EBITDA and net income growth Sales decreased 1.4% Y-o-Y due to the decline in crude and oil products prices -1.4% -1.4% at international markets 432 444 +11.4% 429 815…
EBITDA reconciliation 1H15 vs. 1H14 EBITDA 1H15 vs 1H14, RUB mln Group share in JVs EBITDA Duty lag (1,264) FX 37,333 Urals in MET 78,944 Urals in export duty 47,394 Prices (136,445) external factors = 2,365 management…
EBITDA reconciliation 2Q15 vs. 1Q15 EBITDA 2Q15 vs 1Q15, RUB mln Group share in JVs Duty lag 5,653 EBITDA FX 16,696 Urals in MET (17,692) Urals in export duty (4,194) Prices 11,451 Gazprom neft 22
FCF is slightly negative due to peak investments in greenfield development Cash flow reconciliation 1H 2015, RUB mln 143,998 (148,084) (4,086) (508) 20,763 (20,048) 15,825 (12,962) Bank deposits Operating cash CAPEX*…
Upstream capex growth driven by greenfield development Investments, RUB mln 32% increase in IFRS capex 154,719 51% Y-o-Y higher brownfield capex reflects reclassification of Priobskoye 139,714 fields to brownfield category 52,683…
Commitment to strong and proactive capital management Debt maturity profile at the end of 2Q15 Debt structure at the end of 2Q15, RUB mln 569,475 119,128 Other Cash & cash Bonds equivalents Short-term deposits LPN Bank…
 Loading...