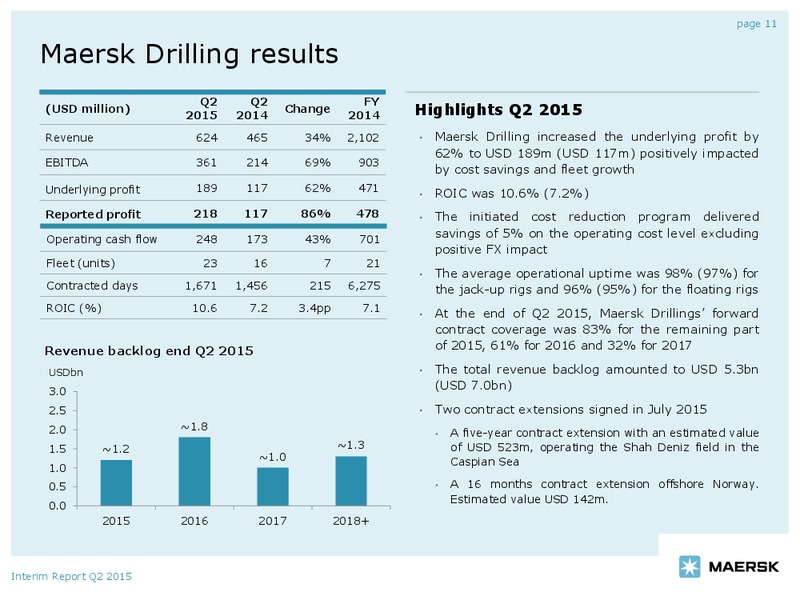
Maersk Group Q2 report 2015 13 August 2015 - Conference call 9.30am CET webcast available at www.maersk.com
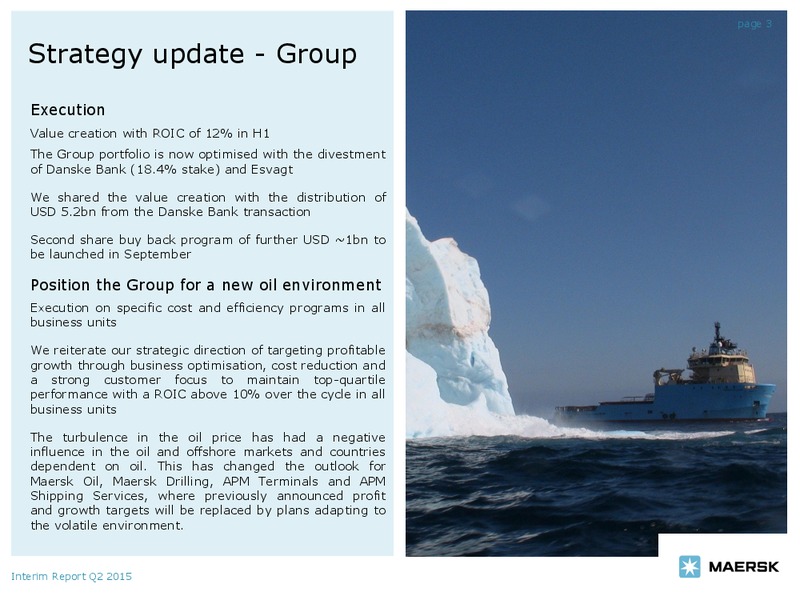
page 3 Strategy update - Group Execution Value creation with ROIC of 12% in H1 The Group portfolio is now optimised with the divestment of Danske Bank (18.4% stake) and Esvagt We shared the value creation with the distribution…
page 4 Strategy update Business Units Improved competitiveness through cost leadership and commercial excellence initiatives. Maintaining EBIT-margin gap of 5%-points to the Maersk Line industry Growth ambition adjusted to growing…
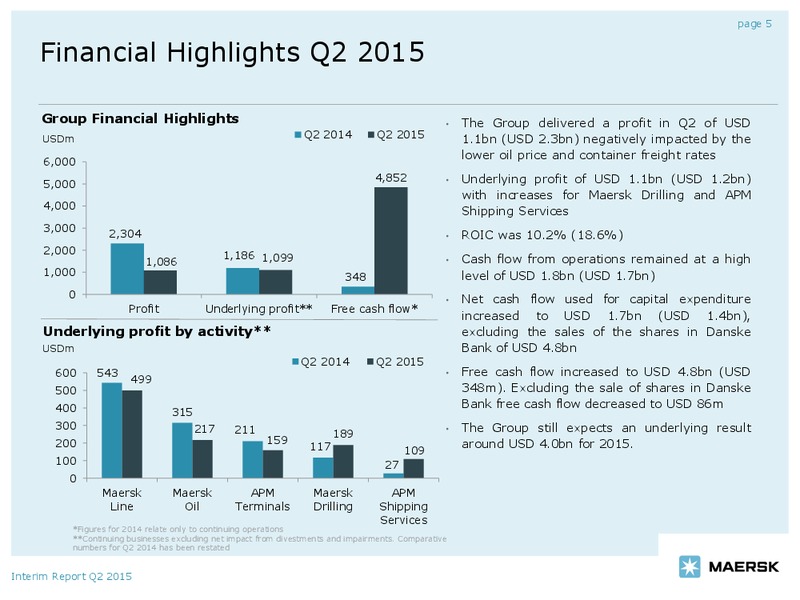
page 5 Financial Highlights Q2 2015 Group Financial Highlights The Group delivered a profit in Q2 of USD USDm Q2 2014 Q2 2015 1.1bn (USD 2.3bn) negatively impacted by the lower oil price and container freight rates 6,000 4,852…
page 6 Maersk Line results Q2 Q2 FY (USD million) 2015 2014 Change 2014 Highlights Q2 2015 Revenue 6,263 6,902 -9.2% 27,351 Maersk Line reported an underlying profit of USD 499m (USD 543m) and a ROIC of 10.1% (10.8%) EBITDA…
page 7 Delivering further cost reductions Unit cost including VSA income Highlights Q2 2015 USD/FFE 3,200 Total cost declined by 9.9% (USD 613m)** 3,092 3,097 3,012 3,010 against a volume increase of 3.7% 3,000 2,871 2,800…
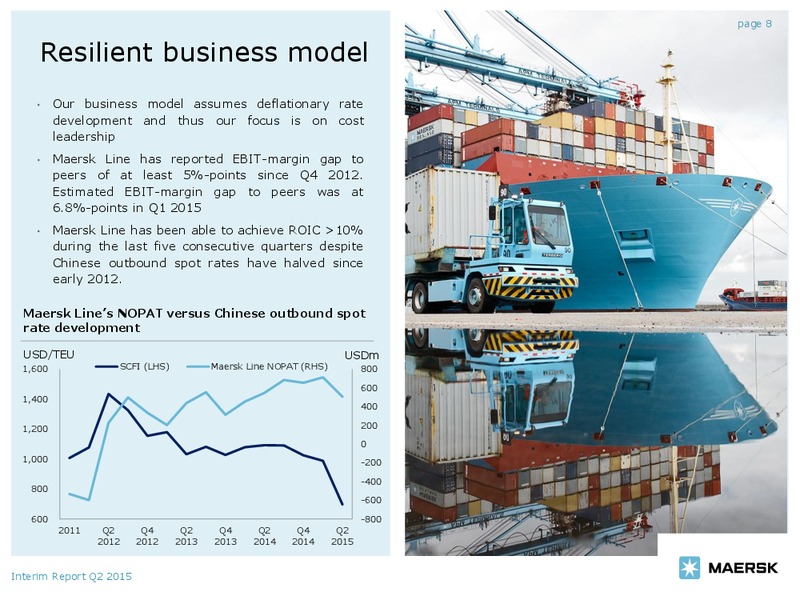
page 8 Resilient business model Our business model assumes deflationary rate development and thus our focus is on cost leadership Maersk Line has reported EBIT-margin gap to peers of at least 5%-points since Q4 2012. Estimated…
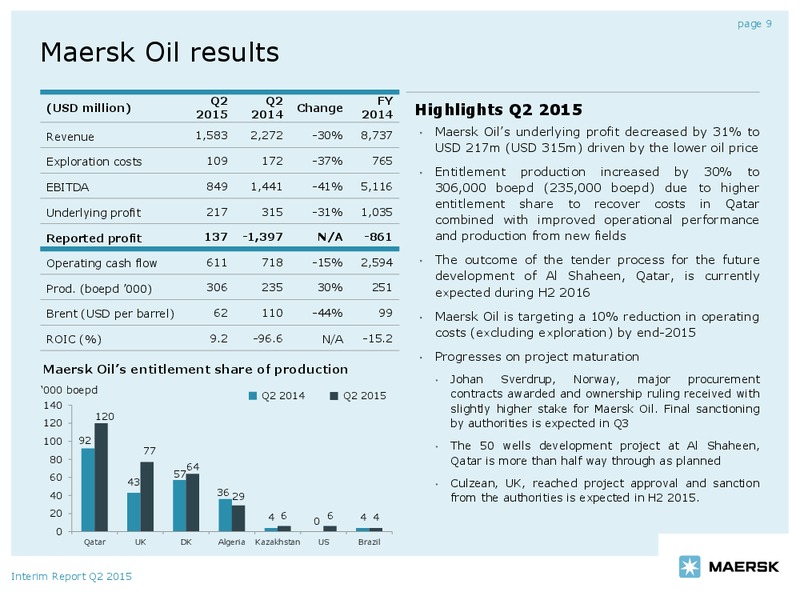
page 9 Maersk Oil results Q2 Q2 FY (USD million) 2015 2014 Change 2014 Highlights Q2 2015 Revenue 1,583 2,272 -30% 8,737 Maersk Oils underlying profit decreased by 31% to USD 217m (USD 315m) driven by the lower oil price…
page 13 Delivering ROIC above 10% in challenging environment Invested Development in invested capital -5Y ROIC % ROIC % ROIC % Business capital Q2 2015 Q2 2014 FY 2014 (USDm) Maersk Drilling 120% Group 47,303 10.2% 18.6%*…
page 14 A strong financial framework Well capitalised position Active portfolio management Net debt has increased USD 1.1bn since Q4 2014 and has Cash flow from divestments has been USD 16.6bn with divestment decreased USD 5.7bn…
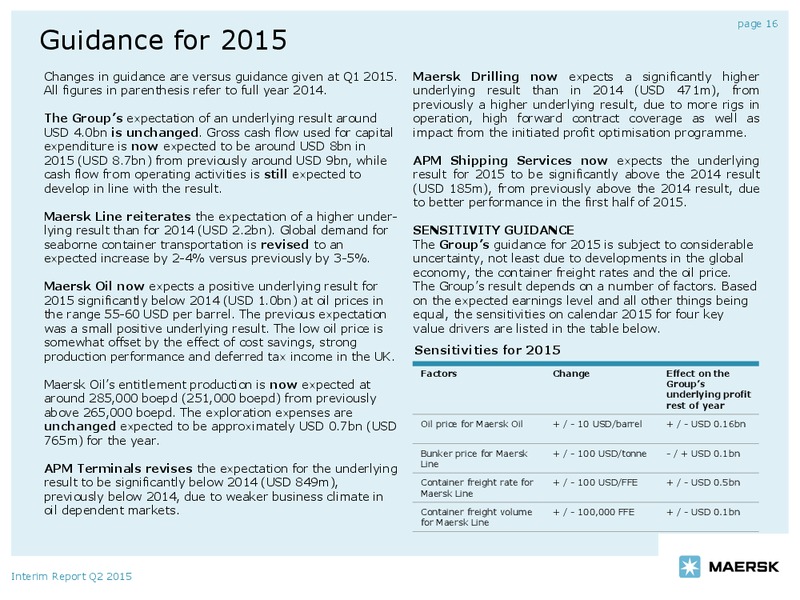
page 16 Guidance for 2015 Changes in guidance are versus guidance given at Q1 2015. Maersk Drilling now expects a significantly higher All figures in parenthesis refer to full year 2014. underlying result than in 2014 (USD 471m),…
 Loading...