2015 Results Presentation 17 August 2015 Year ended 30 June 2015 Dennis Barnes, Chief Executive Officer 1 Graham Cockroft, Chief Financial Officer
Performance highlights 3
Key themes for today Increased Free cash flow improvement cash flow Sales volumes stable Strong retail competition continues to impact margins Transition phase following investment in new systems and plant complete Distribution of…
Safety culture and performance improvement continues Safety is our number one priority and we continue to advance our cultural journey towards generative, to realise our goal of zero harm 55% reduction in TRIFR in FY15 Over 9,000…
Statutory profit down 43% to 133m Underlying earnings per share down 29% Year ended 30 June 2015 EBITDAF1 525m down 11% from 587m Profit 133m down 43% from 234m Earnings per share (cents) 18.2 cps down 43% from 32.0 cps 1…
Margin pressure in mass market and C&I reduces EBITDAF Integrated Energy segment EBITDAF: down 67m (12%) to 484m EBITDAF Movement Netback: unfavourable 61m (7%) FY14 587 Volumes remained stable despite Intergrated Energy 67m…
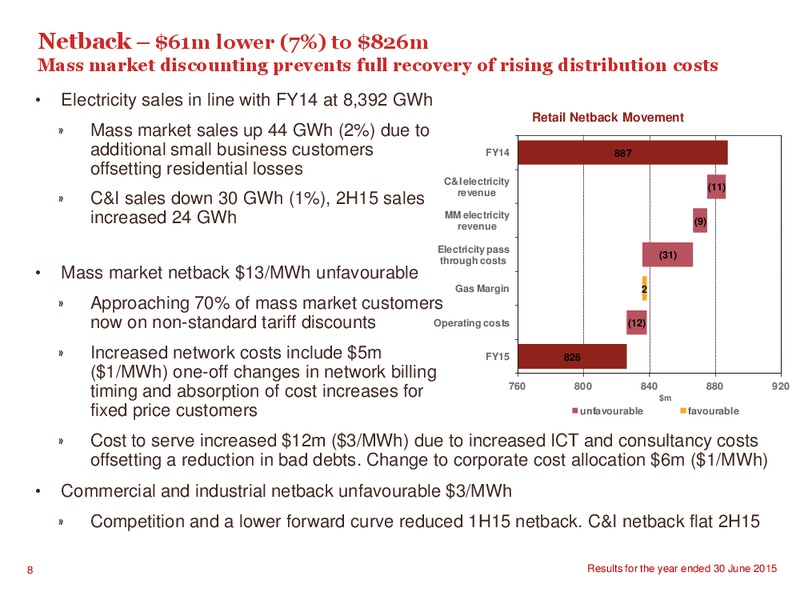
Netback 61m lower (7%) to 826m Mass market discounting prevents full recovery of rising distribution costs Electricity sales in line with FY14 at 8,392 GWh Retail Netback Movement Mass market sales up 44 GWh (2%) due to additional…
Cost of energy unfavourable 6m (2%) to 342m Renewable generation increased from 69% to 76% of total generation Wholesale spot market down 6m due to Cost of Energy Movement higher electricity purchases (up 200 GWh) being partially…
Other segment favourable 5m (14%) to 41m LPG margin up 9m Other segment movements LPG sales up 4,864 tonnes (7%) with reticulated demand responding to cooler weather and additional FY14 36 wholesale sales Profit margin up…
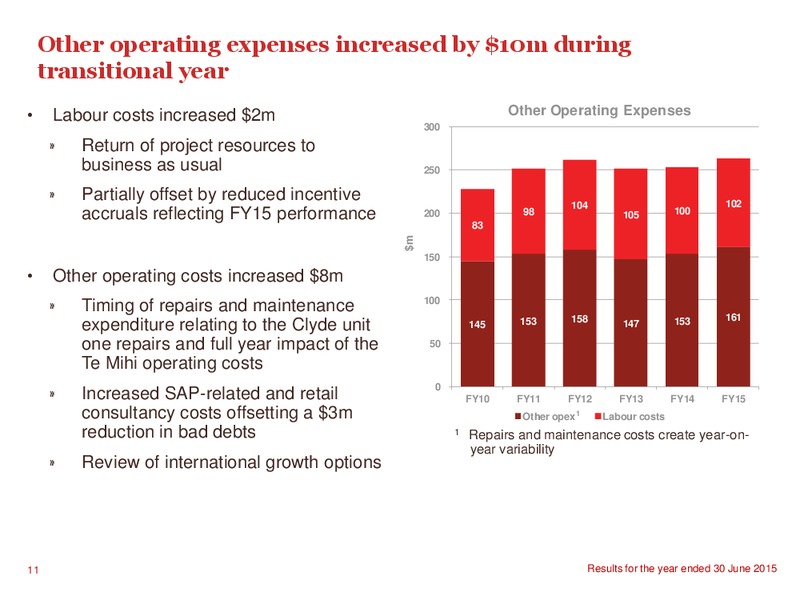
Other operating expenses increased by 10m during transitional year Labour costs increased 2m Other Operating Expenses 300 Return of project resources to business as usual 250 Partially offset by reduced incentive 102 104…
Financial Review Graham Cockroft 12
Statutory profit down 43% to 133m Underlying earnings per share down 29% Year ended Year ended Variance 30 June 2015 30 June 2014 m m m % Profit 133 234 (101) (43%) Earnings per share (cents) 18.2 32.0 (13.8) (43%) Revenue and…
Statutory profit down 43% from 234m to 133m Underlying earnings after tax down 29% from 227m to 161m Contact's statutory profit movement 250 (7) 200 (62) (14) 150 (28) (21) 31 m 234 227 100 161 133 50 0 FY14…
Free cash flow up 21% Year ended Year ended Variance Free cash flow 30 June 2015 30 June 2014 400 m m m % 363 EBITDAF 525 587 (62) (11%) 350 312 Change in working capital 20 (103) 123 119% 299 300 Tax paid (45) (53) 8 15% 265…
Timing of special dividend increased year end gearing ratio Considering retail bond offer; expected to open 24 August Funding maturity profile Funding Diversity 350 6% NEXI 300 USPP 12% Domestic Bank 36% Funding Maturity (…
Net financing costs increased by 21m due to the reduction in capitalised interest Year ended Year ended Variance 30 June 2015 30 June 2014 m m m % Interest income 1 6 (5) (83%) Interest expense (99) (120) 21 18% Financing costs…
FY15 declared dividends 76 cents per share Unimputed final dividend 15 cents per share Share buyback programme to commence in FY16 Dividend policy revised in May to target Free cash flow and allocations 700 average ordinary…
Prospects 19
Transition update Dennis Barnes confirmed as CEO, employed by Contact Contact has commenced the process of finding suitable replacements for departing directors including Bruce Beeren who will retire at the next AGM The permanent…
Contacts capital investments have positioned it well for the New Zealand market Upstream FuelFuel Generation Wholesale/Retail Retailer Generator Largely renewable fuel Flexible generation portfolio Significant customer base…
Contacts cost of energy continues to track down with minimal capital requirements to support cash flow Cost of energy FY16 cost of energy expected to continue to 50 12,000 improve 45 10,000 Improved plant availability following…
Continued wholesale oversupply despite dry conditions and some demand growth Price and national storage levels National demand 160 4,000 FY15 demand increased 2.1% from 4% 140 3,500 FY14 4% 120 3,000 3% 7 day average price…
Contact to close Otahuhu power station from September 2015 Continued oversupply makes hold costs uneconomic Market currently oversupplied System Operator North Island security Capacity factor of Contacts CCGTs of supply assessment…
2018 Huntly closure too long dated to support hold costs Cost reduction outweighs revenue uncertainty Alternative to closing is to put Otahuhu into storage until Huntly closes Otahuhu expected to have 8,000 operating hours at the…
TCC will be refurbished to gain 24,000 additional operating hours Capex cost of 45m over FY16/17 377 MW but can operate down to 140 MW with limited heat rate degradation. Potential to operate down to 100MW Consolidated…
From 2019 the market will likely require additional flexible capacity not energy Contact well positioned to support flexible development when it is needed Ahuroa gas storage provides 45TJ/day gas extraction and 27TJ/day of gas…
Retail Transformation provides a platform for efficiency and innovation in a highly competitive market Stabilise Optimise Sustain Data Stabilise Insight driven using SMART, customer & customer Target customers demographic data numbers…
Retail stabilisation substantially complete Customer service metrics all now close to pre go-live levels Key front and back office metrics now at, or close Customer satisfaction survey to, pre go-live levels 10 CEM (3 month…
Outlook Continued strong free cash flow Lower cost to serve to offset continued intense retail competition C&I load reduced following the non-renewal of the Fonterra electricity contract Customer business begins to move beyond…
Key themes from today Increased Free cash flow improvement cash flow Sales volumes stable Strong retail competition continues to impact margins Transition phase following investment in new systems and plant complete Distribution of…
Supporting material 32
Non-GAAP profit measure - EBITDAF EBITDAF is Contacts earnings before net interest expense, tax, depreciation, amortisation, change in fair value of financial instruments and other significant items The CEO monitors EBITDAF as a key…
Explanation of reconciliation between EBITDAF and profit The adjustments from EBITDAF to reported profit are as follows: Depreciation and amortisation: Costs increased by 14m (7%) reflecting commissioning of Te Mihi and go-live of…
Non-GAAP profit measure underlying earnings The CEO monitors underlying earnings and believes it assists investors to understand the ongoing performance of the business Underlying earnings after tax is calculated by adjusting reported…
Explanation of reconciliation from reported profit to underlying earnings The adjustments from reported profit to underlying earnings are as follows: The change in fair value of financial instruments that do not qualify for hedge…
OCAT, OCAT ratio and free cash flow Free cash flow Free cash flow measures the cash generating performance of the business and represents cash available to fund distributions to shareholders and growth capital expenditure. Free cash…
 Loading...