Oaktree: A Leading Global Alternative Asset Manager A leader and pioneer in alternative asset management global footprint1 with 103 billion of AUM Amsterdam London Frankfurt Diversified mix of pro- and counter-cyclical strategies…
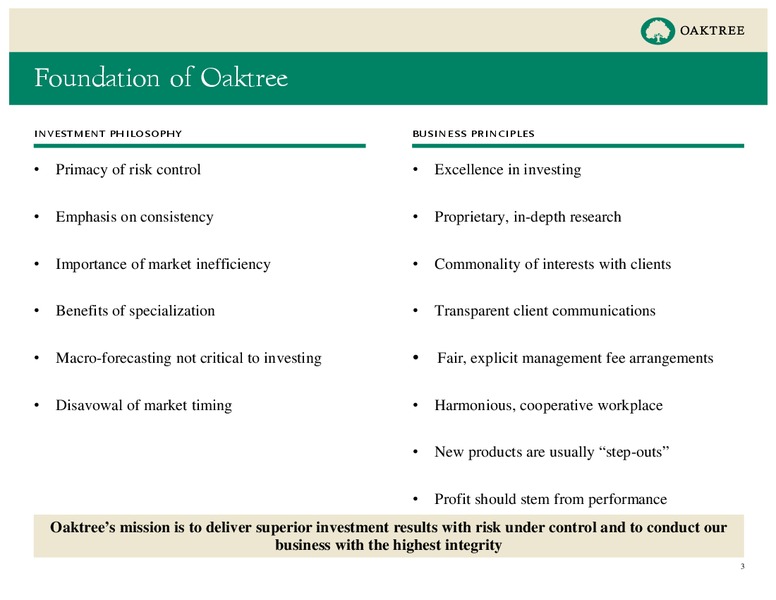
Foundation of Oaktree investment philosophy business principles Primacy of risk control Excellence in investing Emphasis on consistency Proprietary, in-depth research Importance of market inefficiency Commonality of interests…
History of Exceptional Investment Performance superior returns, both gross and risk-adjusted, in our open-end funds Annualized gross return since inception Sharpe ratio since inception2 0.81 9.6% 9.9% 8.5% 8.4% 0.56 0.43 0.28…
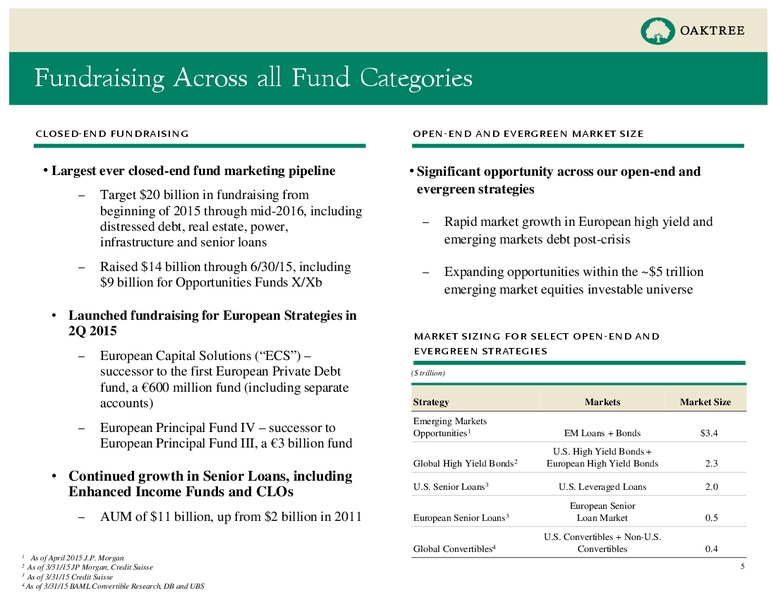
Fundraising Across all Fund Categories closed-end fundraising open-end and evergreen market size Largest ever closed-end fund marketing pipeline Significant opportunity across our open-end and Target 20 billion in fundraising from…
Oaktree Hallmark: Funds Sized to Opportunity Set opportunities funds sizing ( in billions) -59%1 10.9 Increase fund size ahead of potential market dislocation 7.0 Scale back funds when opportunity set shrinks -40%1 5.1…
Growing Investor Base of Leading Institutions blue-chip clientele diversifying and growing our clientele 100 largest U.S. pension funds 75 ( in billions) 12/31/06 6/30/15 % of AUM represented by: States 39 HNW and sub-advisory clients…
Recently Launched Products, A Natural Evolution more than 16 billion of aum in adjacent products launched since 2011 As of December 31, unless otherwise noted ( in millions) Growth a result of step-out strategies 18,000 16,818 15,401…
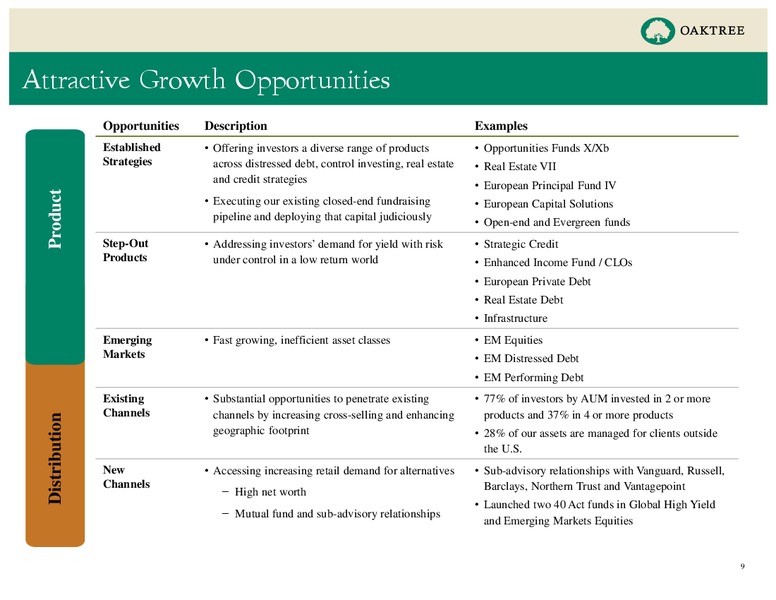
Attractive Growth Opportunities Opportunities Description Examples Established Offering investors a diverse range of products Opportunities Funds X/Xb Strategies across distressed debt, control investing, real estate Real Estate VII…
Disciplined Approach to Growth assets under management As of December 31, unless otherwise noted ( in billions) 103 FGAUM has grown every year since our 91 founding (with the exception of a 0.3% 83 84 decrease in 2012) 75 77…
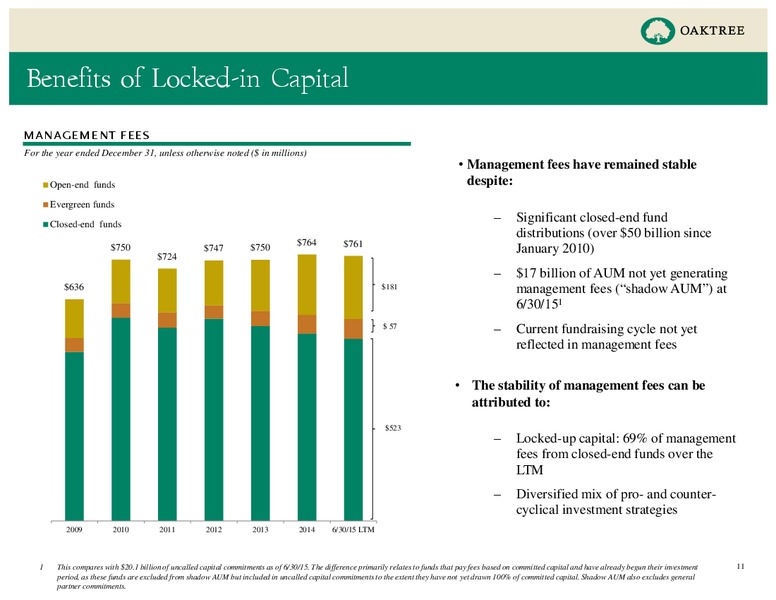
Benefits of Locked-in Capital management fees For the year ended December 31, unless otherwise noted ( in millions) Management fees have remained stable Open-end funds despite: Evergreen funds Closed-end funds Significant…
Incentive Income Pipeline incentive income recognized total accrued incentives, net: 1.0 billion Gross ( in millions) 1,030 18% 45% 491 461 353 37% 2012 2013 2014 6/30/15 LTM Liquidating Funds (Not Yet Paying) 1…
Substantial Asset Value with Significant Upside Includes: book value 11.441 1.6 billion Investments 0.1 billion Net Cash + + accrued incentives 6.541 82% in liquidating or evergreen funds (fund level), net DoubleLine…
2Q15 LTM Equity Distributions ( in millions) Since our IPO through 1Q14, we paid out approximately 80% of our distributable 511 earnings to investors; in 2Q14, we 434 Distributable Earnings increased our target payout ratio to…
Appendix
Strategy Initiation Emerging Markets European Total Return Senior Loans European Asia Real Estate Emerging Infrastructure High Yield Principal Debt Markets Investing Bonds Opportunities U.S. High Income Oaktree Power European…
Preponderance of Capital in Long-Term Closed-End Funds % Management % of AUM Fees1 Lockup Incentive Income CLOSED-END Distressed debt 20% of LP profits after Control investing 57% 67% 10-11 year fund term return of capital,…
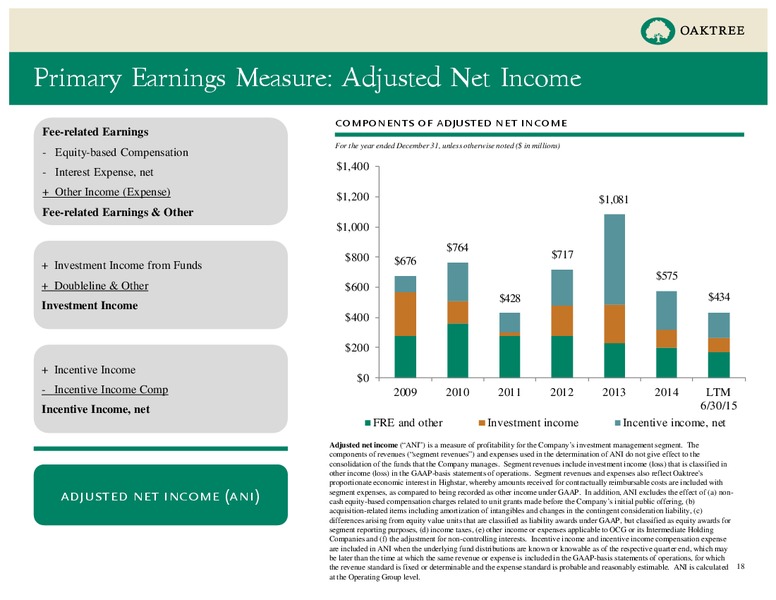
Primary Earnings Measure: Adjusted Net Income components of adjusted net income Fee-related Earnings For the year ended December 31, unless otherwise noted ( in millions) - Equity-based Compensation - Interest Expense, net 1,400 +…
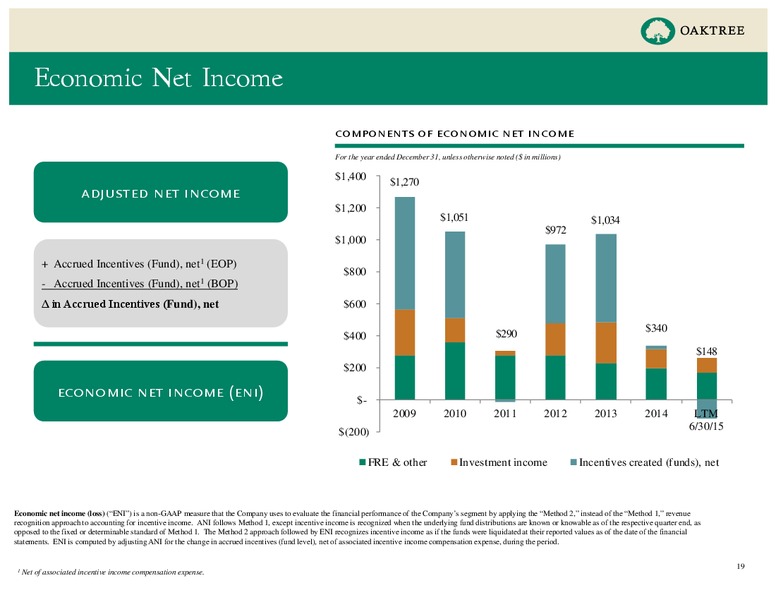
Economic Net Income components of economic net income For the year ended December 31, unless otherwise noted ( in millions) 1,400 1,270 adjusted net income 1,200 1,051 1,034 972 1,000 + Accrued Incentives (Fund), net1 (EOP)…
Distributable Earnings components of distributable earnings adjusted net income For the year ended December 31, unless otherwise noted ( in millions) 1,400 1,200 - Investment Income (MTM basis) 984 + Receipts Of Investment…
Disclosures: Fund Table Provides Meaningful Insights Incentive income Reflects the amount Shows when that would be of distributions management fee basis Incentive income recognized if fund required for fund to changes from…
Reconciliations of Non-GAAP Metrics Last 12 mos. Ended June 30, 2009 2010 2011 2012 2013 2014 For the year ended December 31, unless otherwise noted ( in thousands) 2014 2015 Reconciliation of Net Income (Loss) Attributable to…
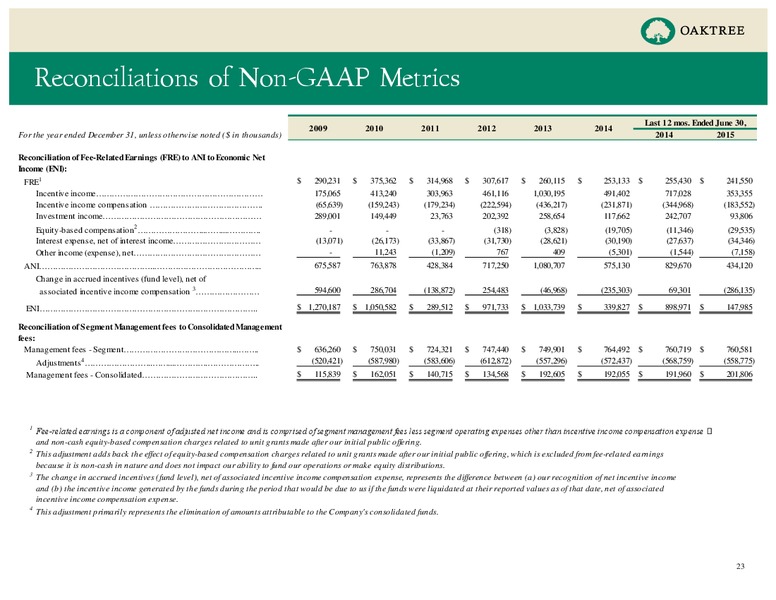
Reconciliations of Non-GAAP Metrics Last 12 mos. Ended June 30, 2009 2010 2011 2012 2013 2014 For the year ended December 31, unless otherwise noted ( in thousands) 2014 2015 Reconciliation of Fee-Related Earnings (FRE) to ANI to…
Benchmark Disclosures benchmark detail U.S. High Yield Bonds: Citigroup U.S. High Yield Cash-Pay Capped Index U.S. Convertibles: Oaktree custom convertible index that represents the Credit Suisse Convertible Securities Index from…
 Loading...