Agenda Recent developments Financial results Operations/projects Outlook 3
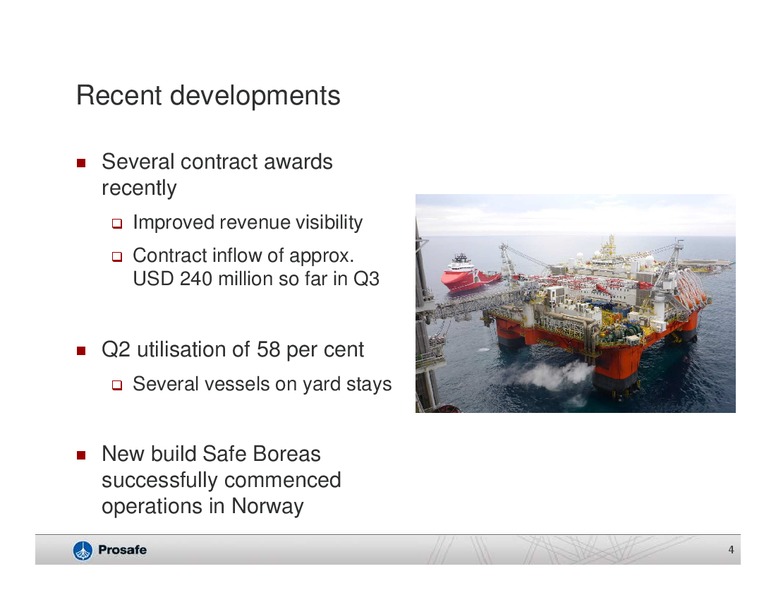
Recent developments Several contract awards recently Improved revenue visibility Contract inflow of approx. USD 240 million so far in Q3 Q2 utilisation of 58 per cent Several vessels on yard stays New build Safe Boreas…
Agenda Recent developments Financial results Operations/projects Outlook 5
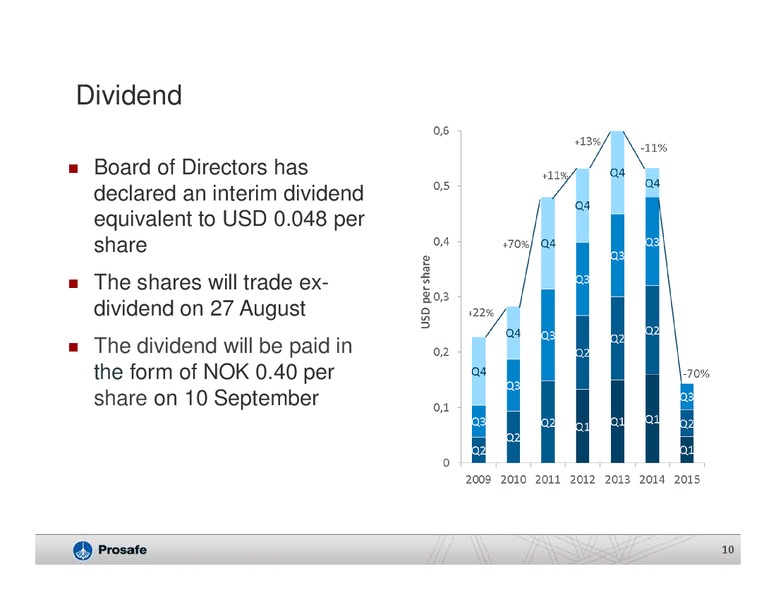
Dividend Board of Directors has declared an interim dividend equivalent to USD 0.048 per share The shares will trade ex- dividend on 27 August The dividend will be paid in the form of NOK 0.40 per share on 10 September 10
Agenda Recent developments Financial results Operations/projects Outlook 11
Fleet utilisation Utilisation rate of 58 per cent in Q2 Safe Bristolia, Safe Britannia, Safe Scandinavia and Safe Concordia had yard stays in the quarter Regalia, Safe Astoria, Safe Regency, Safe Lancia and Safe Hibernia were…
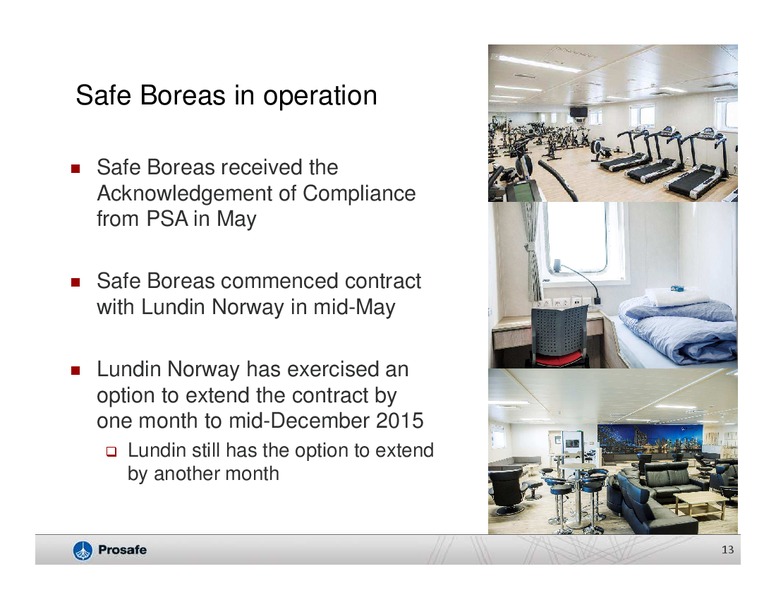
Safe Boreas in operation Safe Boreas received the Acknowledgement of Compliance from PSA in May Safe Boreas commenced contract with Lundin Norway in mid-May Lundin Norway has exercised an option to extend the contract by one…
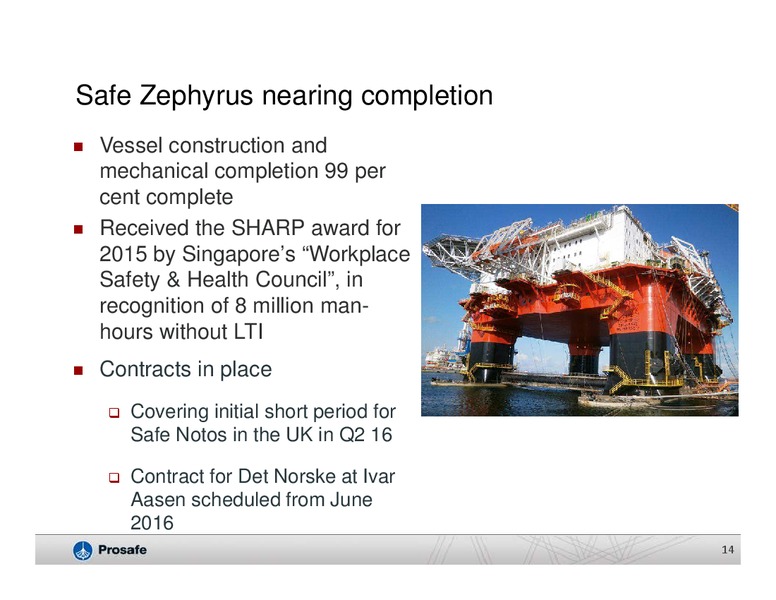
Safe Zephyrus nearing completion Vessel construction and mechanical completion 99 per cent complete Received the SHARP award for 2015 by Singapores Workplace Safety & Health Council, in recognition of 8 million man- hours without…
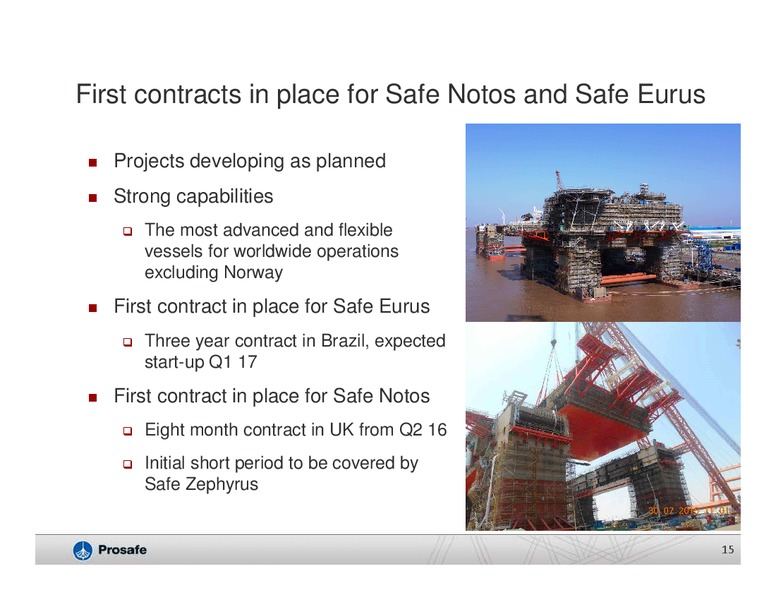
First contracts in place for Safe Notos and Safe Eurus Projects developing as planned Strong capabilities The most advanced and flexible vessels for worldwide operations excluding Norway First contract in place for Safe Eurus…
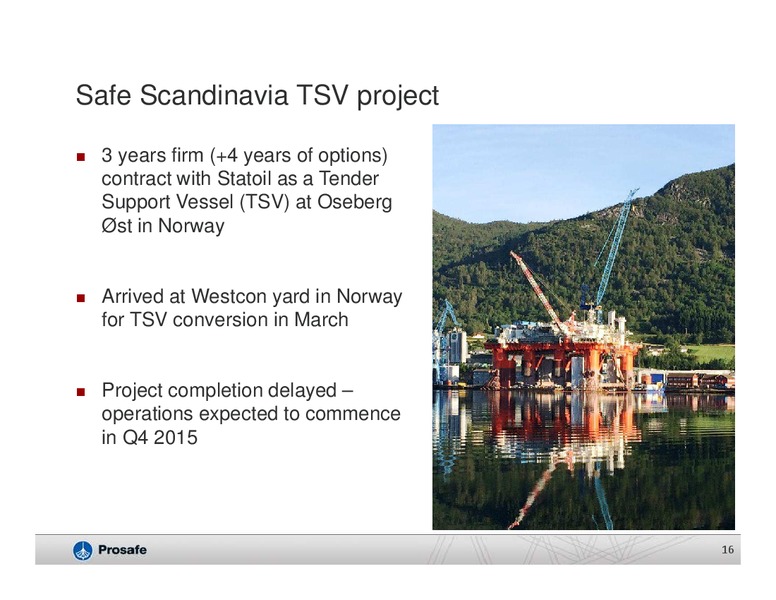
Safe Scandinavia TSV project 3 years firm (+4 years of options) contract with Statoil as a Tender Support Vessel (TSV) at Oseberg st in Norway Arrived at Westcon yard in Norway for TSV conversion in March Project completion…
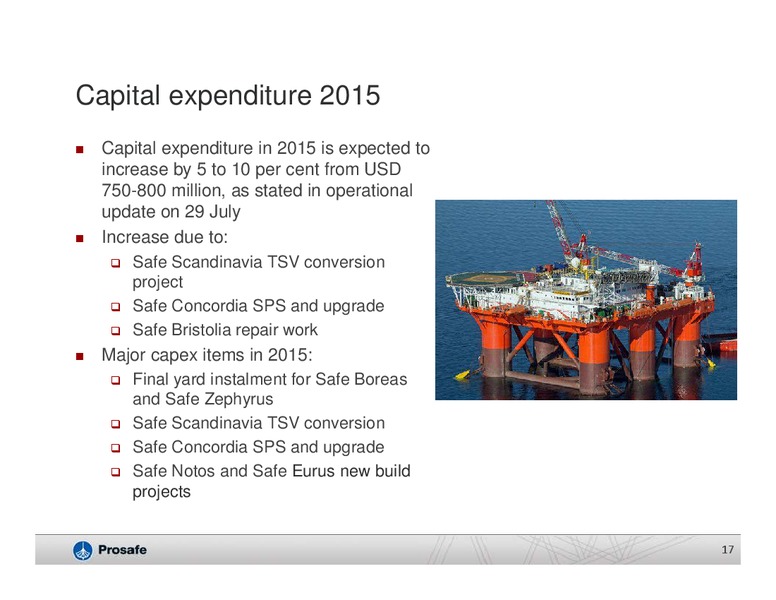
Capital expenditure 2015 Capital expenditure in 2015 is expected to increase by 5 to 10 per cent from USD 750-800 million, as stated in operational update on 29 July Increase due to: Safe Scandinavia TSV conversion project Safe…
Capex coming down after completion of projects USD 50-60 million expected accross the fleet in 2017 Executed and planned capex projects Regalia Caledonia Scandinavia Boreas Notos Zephyrus Eurus Scandinavia 1000 Concordia 900…
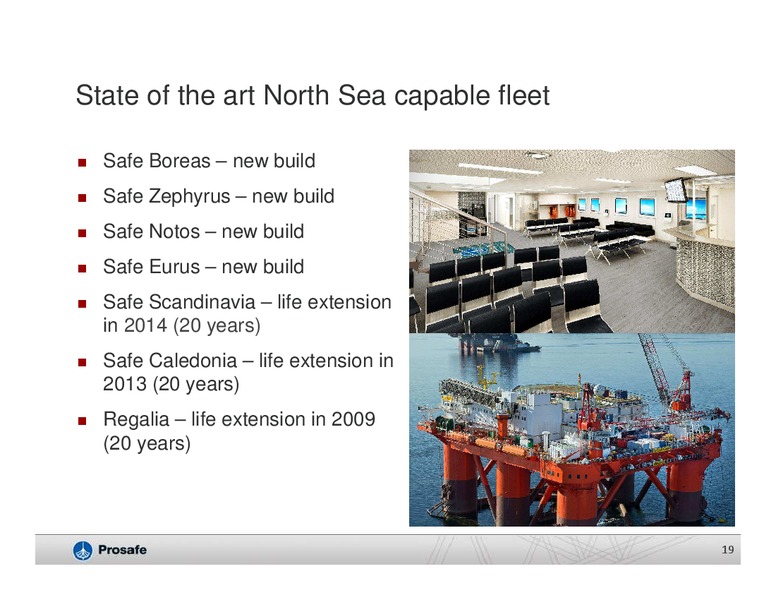
State of the art North Sea capable fleet Safe Boreas new build Safe Zephyrus new build Safe Notos new build Safe Eurus new build Safe Scandinavia life extension in 2014 (20 years) Safe Caledonia life extension in 2013 (20 years)…
Agenda Recent developments Financial results Operations/projects Outlook 20
Difficult market conditions Prosafe well prepared Market outlook in brief Prosafes response Near term improved State of the art fleet Challenging market Upgrades and life medium term extensions Long-term demand drivers New builds…
Leading provider of offshore accommodation vessels Prosafe is the leading owner No. of accommodation semis by owner and operator of 34 POSH 32 accommodation semis 30 28 Yiu Lian 26 OOS High quality and versatile fleet 24 Axis…
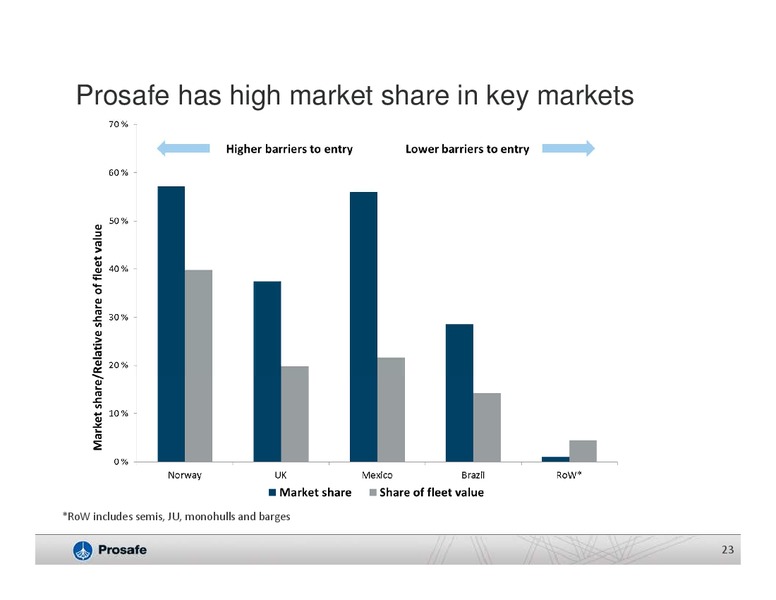
Prosafe has high market share in key markets *RoW includes semis, JU, monohulls and barges 23
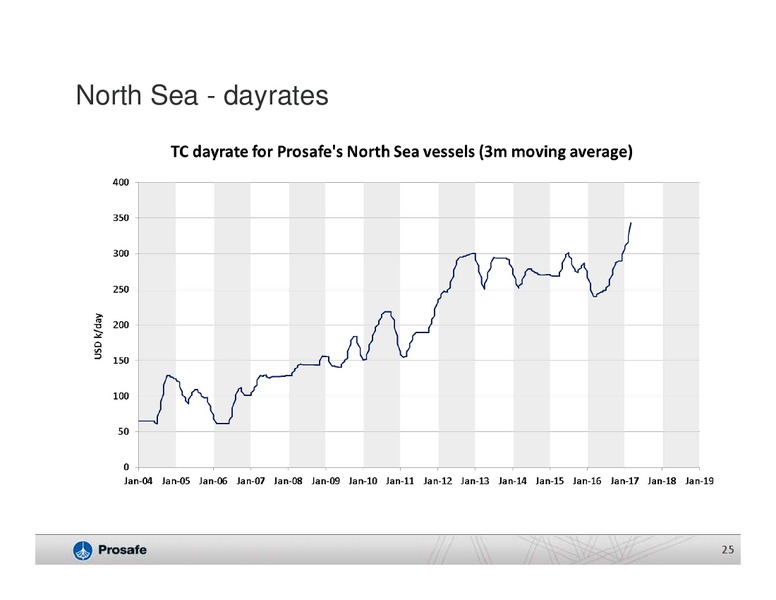
North Sea near term improved for Prosafe Near term improved for Prosafe Three year demand index drop confirming Recent contract awards previously expected deferrals and descoping Medium term remains uncertain Pressure on clients to…
North Sea - dayrates 25
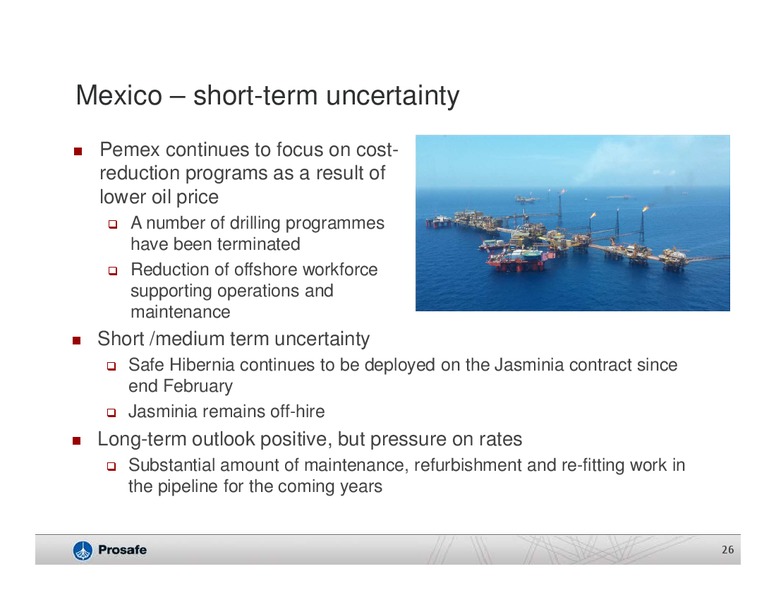
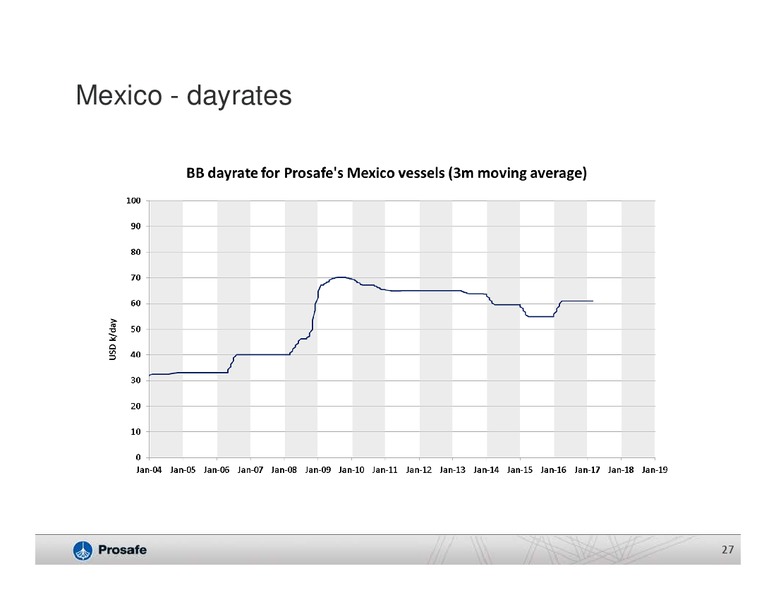
Mexico short-term uncertainty Pemex continues to focus on cost- reduction programs as a result of lower oil price A number of drilling programmes have been terminated Reduction of offshore workforce supporting operations and…
Mexico - dayrates 27
Brazil new three year contract awarded Three year contract signed with Petrobras for Safe Eurus Long term outlook remains positive for high end vessels Demand for lower-end equipment diminishing Many non-semi assets…
Rest of the world - in brief Australia Prospects related to hook-up and commissioning As fields are getting older, there should be potential for more maintenance and modification related work South East Asia Prospects in mid and…
Rest of world, excl. NS - dayrates 30
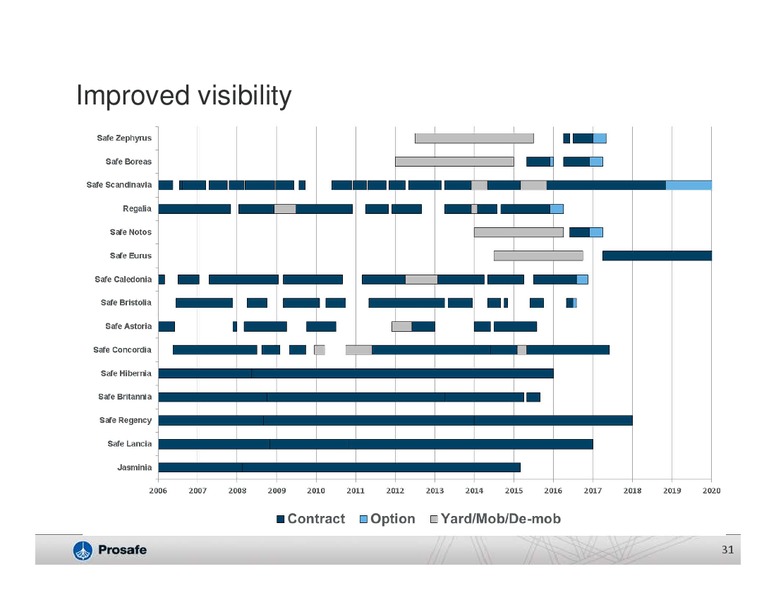
Improved visibility 31
Offshore accommodation a late cyclical market Accommodation vessel need Hook-up/ Explo- Develop- Decomm- commis- Production ration ment issioning sioning Back to normal: majority of prospects currently being maintenance…
Contract backlog robust Added considerable contract backlog the last week Gross value of charter contracts Status end Q2 15 2 500 Firm contracts USD 1,024m + Options (1) USD 604m = Total USD 1,628m 2 000 Options Letter of…
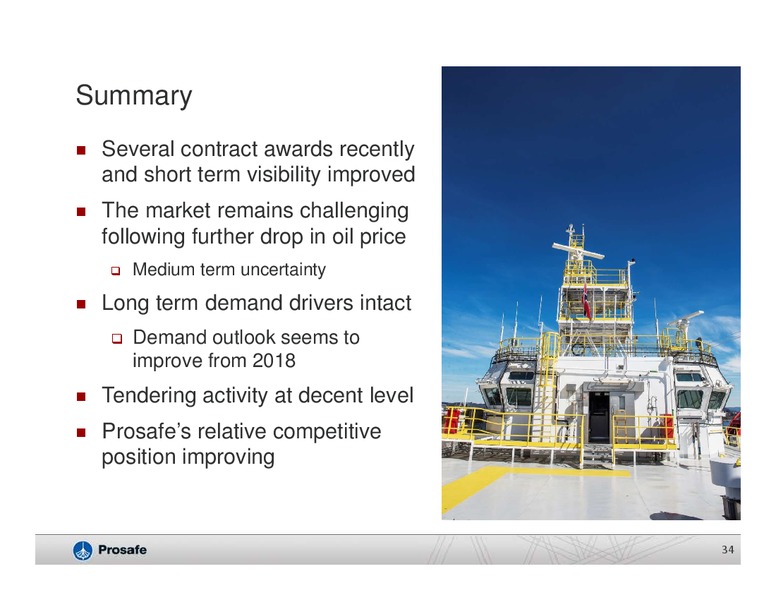
Summary Several contract awards recently and short term visibility improved The market remains challenging following further drop in oil price Medium term uncertainty Long term demand drivers intact Demand outlook seems to improve…
 Loading...