Danske Bank Markets Summer Update EVP & CFO Gottfred Langseth Oslo, August 20, 2015
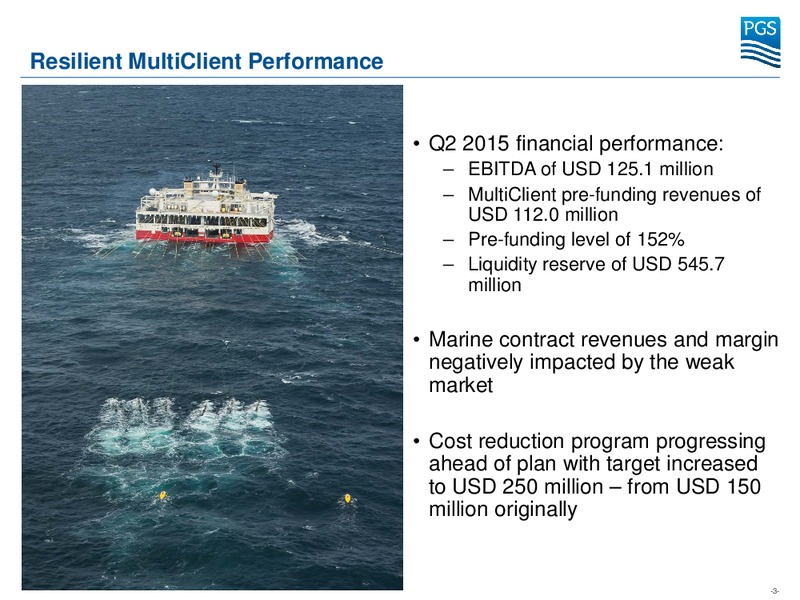
Resilient MultiClient Performance Q2 2015 financial performance: EBITDA of USD 125.1 million MultiClient pre-funding revenues of USD 112.0 million Pre-funding level of 152% Liquidity reserve of USD 545.7 million Marine contract…
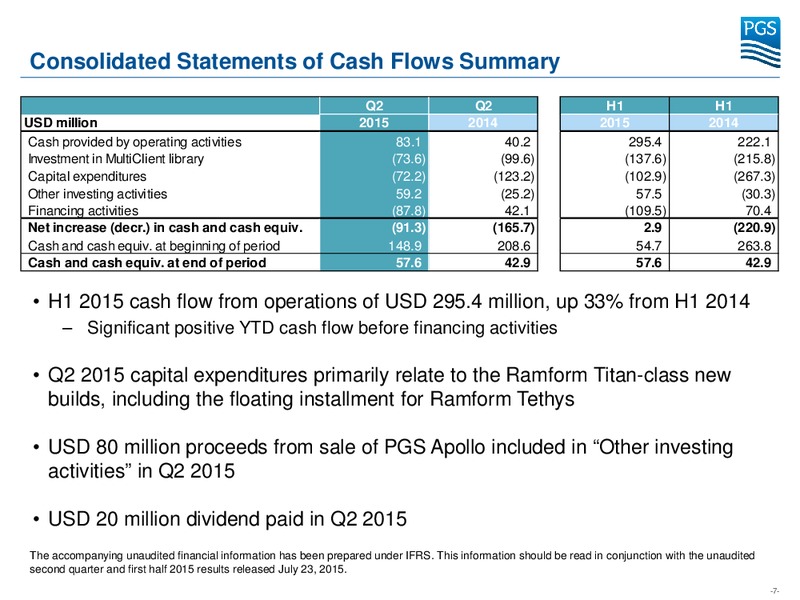
Consolidated Statements of Cash Flows Summary Q2 Q2 H1 H1 USD million 2015 2014 2015 2014 Cash provided by operating activities 83.1 40.2 295.4 222.1 Investment in MultiClient library (73.6) (99.6) (137.6) (215.8) Capital expenditures…
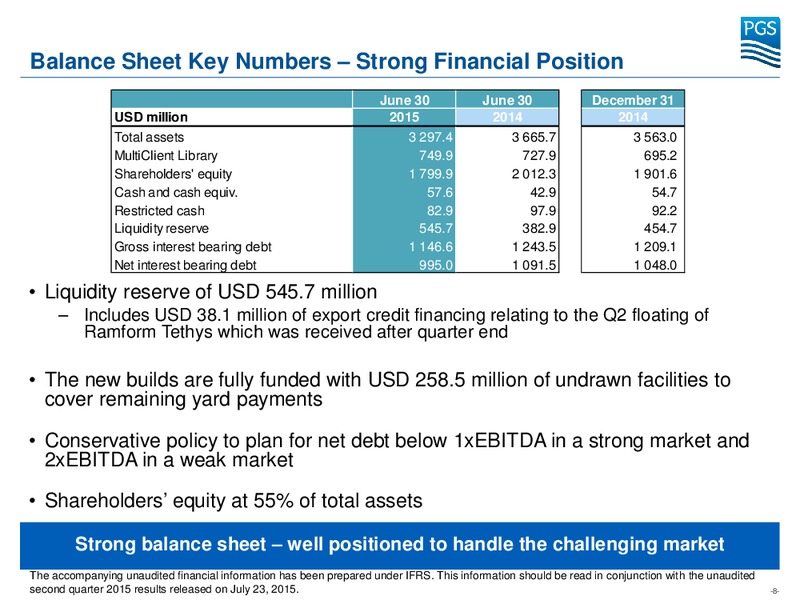
Balance Sheet Key Numbers Strong Financial Position June 30 June 30 December 31 USD million 2015 2014 2014 Total assets 3 297.4 3 665.7 3 563.0 MultiClient Library 749.9 727.9 695.2 Shareholders' equity 1 799.9 2 012.3 1 901.6 Cash…
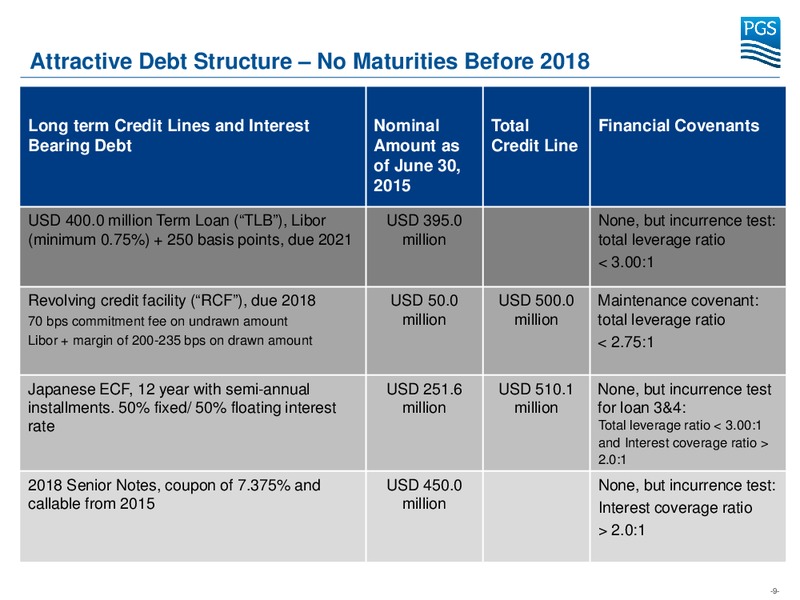
Attractive Debt Structure No Maturities Before 2018 Long term Credit Lines and Interest Nominal Total Financial Covenants Bearing Debt Amount as Credit Line of June 30, 2015 USD 400.0 million Term Loan (TLB), Libor USD 395.0 None, but…
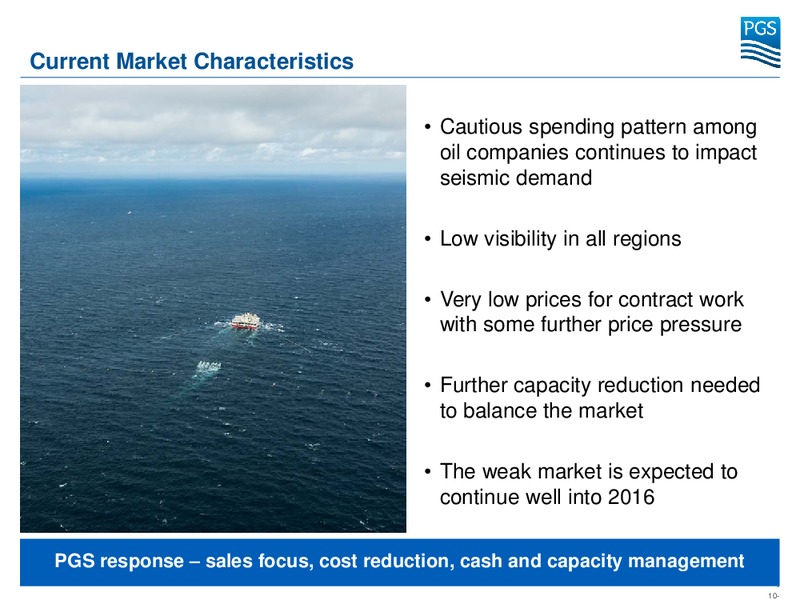
Current Market Characteristics Cautious spending pattern among oil companies continues to impact seismic demand Low visibility in all regions Very low prices for contract work with some further price pressure Further capacity…
Marine Contract Bidding Activity 3 500 3 000 Very low bidding activity impacts industry pricing and 2 500 utilization USD million 2 000 Best contract opportunities are currently in Asia Pacific, especially Myanmar, with…
Order Book 700 Order book of USD 259 600 million by end Q2 2015 20% less capacity to fill from Q4 500 Vessel booking improved USD million 400 post quarter close* 95% booked for Q3 2015 300 65% booked for Q4 2015…
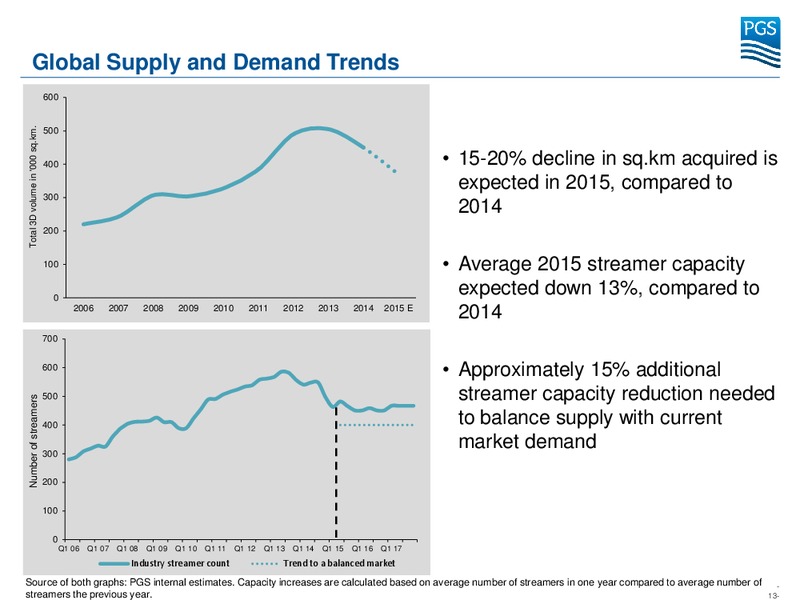
Global Supply and Demand Trends 600 Total 3D volume in '000 sq.km. 500 400 15-20% decline in sq.km acquired is expected in 2015, compared to 300 2014 200 100 Average 2015 streamer capacity 0 expected down 13%, compared…
Good MultiClient Sales Performance from All Vintages 900 Strong sales progress for all 800 vintages 700 Moderate net book values (NBV) for surveys completed 2010- 600 2015 USD million 500 Work In Progress (WIP)…
Solid MultiClient Pre-funding 180 % 160 % 140 % Pre-funding level in H1 2015 has averaged 144% MC pre-funding 120 % 100 % Driven by projects in Africa, Europe and Australia 80 % 155 % 151 % 143 % 143 % 144 % 60 % 112…
In Conclusion: Well Positioned to Navigate the Challenging Market Resilient MultiClient performance Robust balance sheet No debt maturities before 2018 Reducing costs further Cost effective operations Improved productivity…
 Loading...