2015 FULL YEAR RESULTS ANNOUNCEMENT Financial Year Ended 30 June 2015 Grant King, Managing Director Karen Moses, Executive Director, Finance and Strategy 20 August 2015
Outline 1.Performance Highlights Grant King 2.Financial Review Karen Moses 3.Operational Review Grant King 4.Prospects Grant King 5.Appendix 3
1. PERFORMANCE HIGHLIGHTS Grant King, Managing Director 4
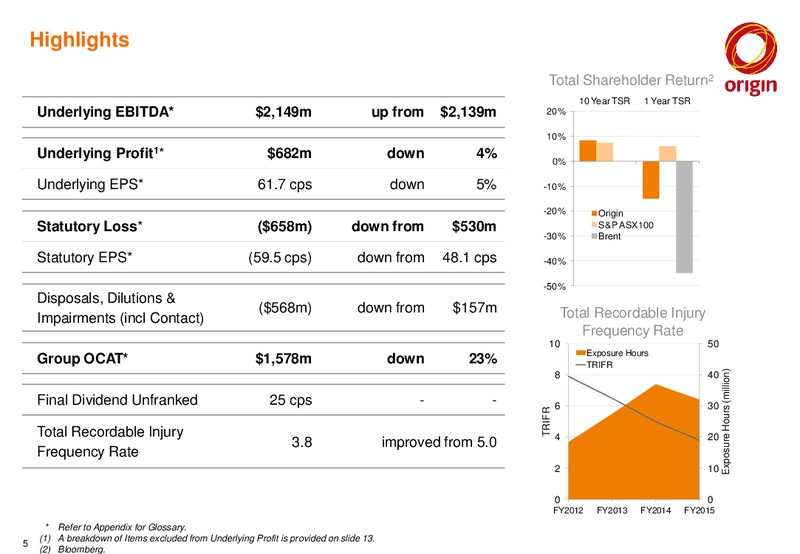
Highlights Total Shareholder Return2 10 Year TSR 1 Year TSR Underlying EBITDA* 2,149m up from 2,139m 20% 10% Underlying Profit1* 682m down 4% 0% Underlying EPS* 61.7 cps down 5% -10% -20% Origin Statutory Loss* (658m) down…
Origin has delivered a solid operational performance and significant progress on implementation of its 4 key priorities Increased Natural Gas contribution 1 Managed margin and customer position 4 IMPROVING RETURNS Reduced operating…
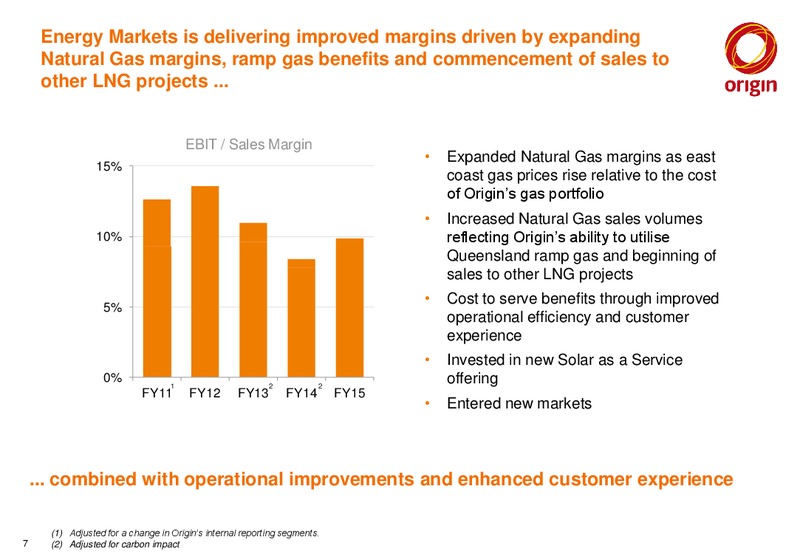
Energy Markets is delivering improved margins driven by expanding Natural Gas margins, ramp gas benefits and commencement of sales to other LNG projects ... EBIT / Sales Margin Expanded Natural Gas margins as east 15% coast gas…
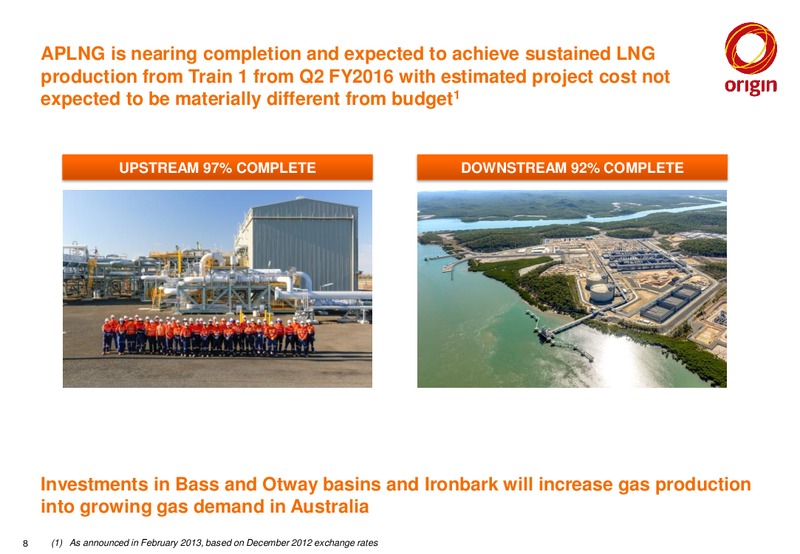
APLNG is nearing completion and expected to achieve sustained LNG production from Train 1 from Q2 FY2016 with estimated project cost not expected to be materially different from budget1 UPSTREAM 97% COMPLETE DOWNSTREAM 92%…
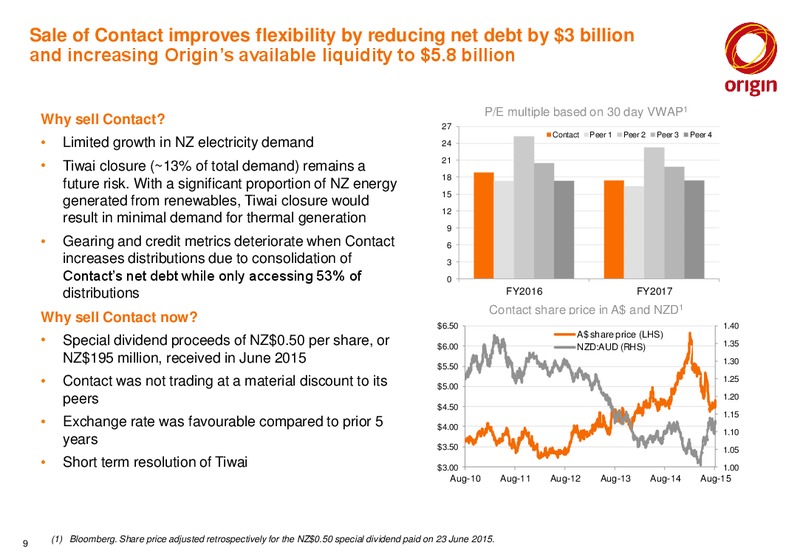
Sale of Contact improves flexibility by reducing net debt by 3 billion and increasing Origins available liquidity to 5.8 billion P/E multiple based on 30 day VWAP1 Why sell Contact 27 Contact Peer 1 Peer 2 Peer 3 Peer 4 Limited…
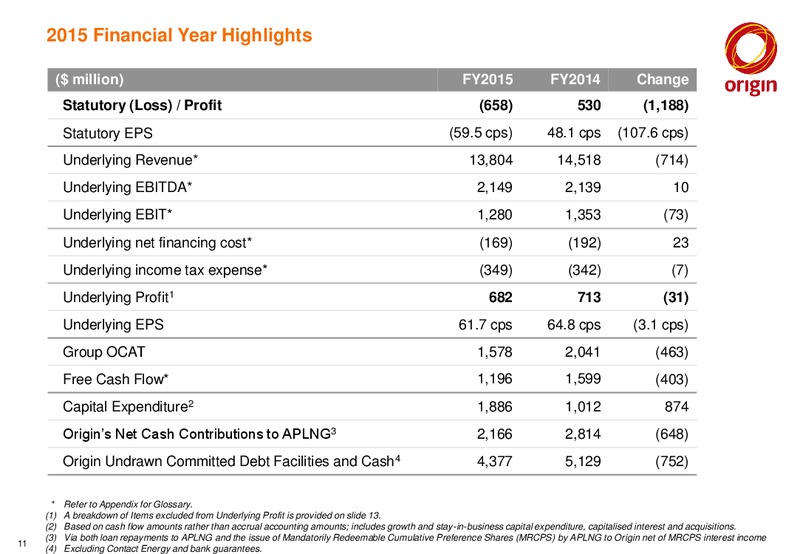
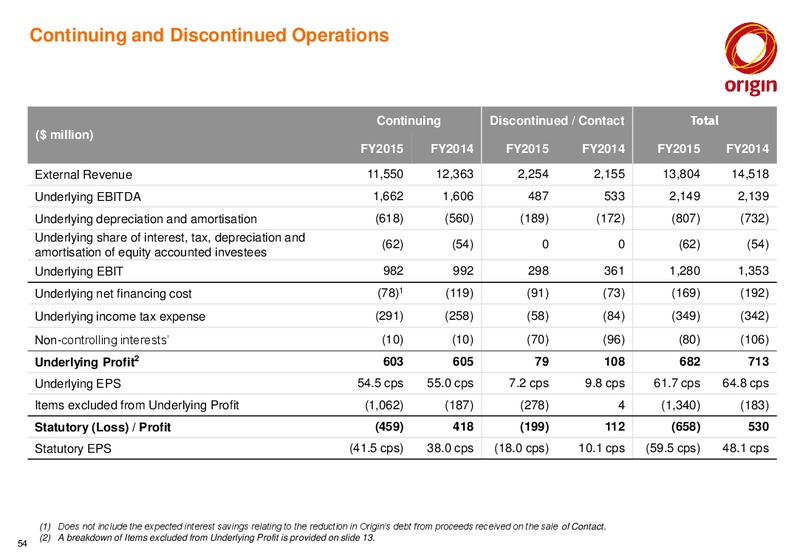
Underlying EBITDA up 10 million to 2,149 million Underlying EBIT down 73 million to 1,280 million Underlying EBITDA Underlying EBIT ( million) FY2015 FY2014 Change FY2015 FY2014 Change Energy Markets 1,260 1,053 20% 956 787 21%…
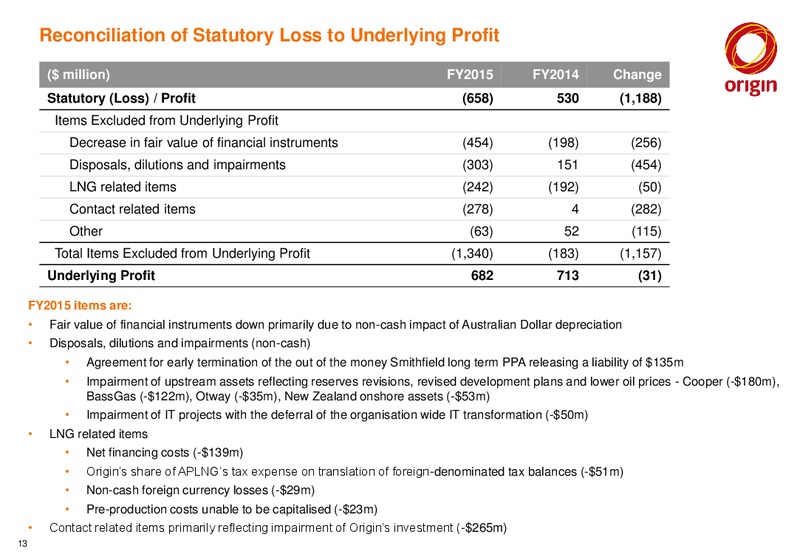
Reconciliation of Statutory Loss to Underlying Profit ( million) FY2015 FY2014 Change Statutory (Loss) / Profit (658) 530 (1,188) Items Excluded from Underlying Profit Decrease in fair value of financial instruments (454) (198)…
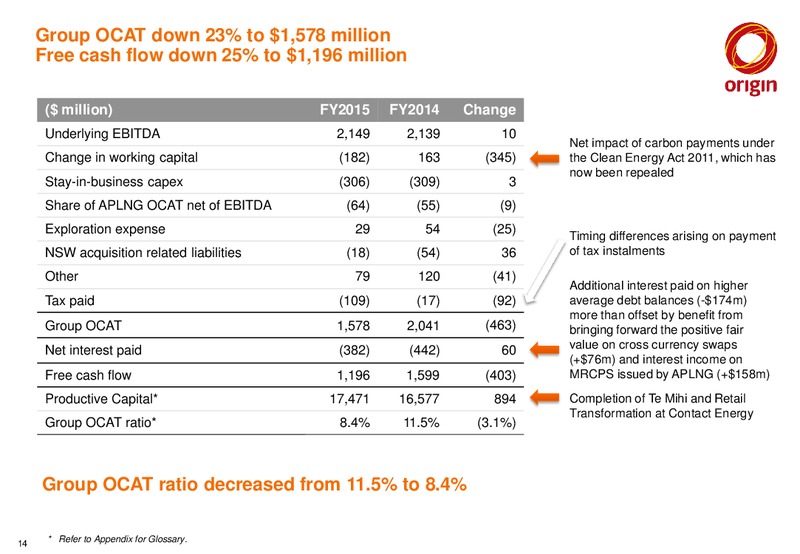
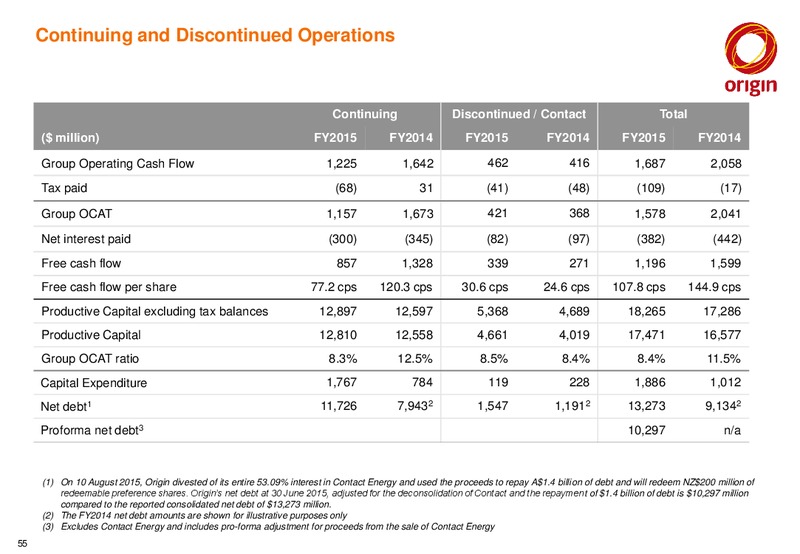
Group OCAT down 23% to 1,578 million Free cash flow down 25% to 1,196 million ( million) FY2015 FY2014 Change Underlying EBITDA 2,149 2,139 10 Net impact of carbon payments under Change in working capital (182) 163 (345) the Clean…
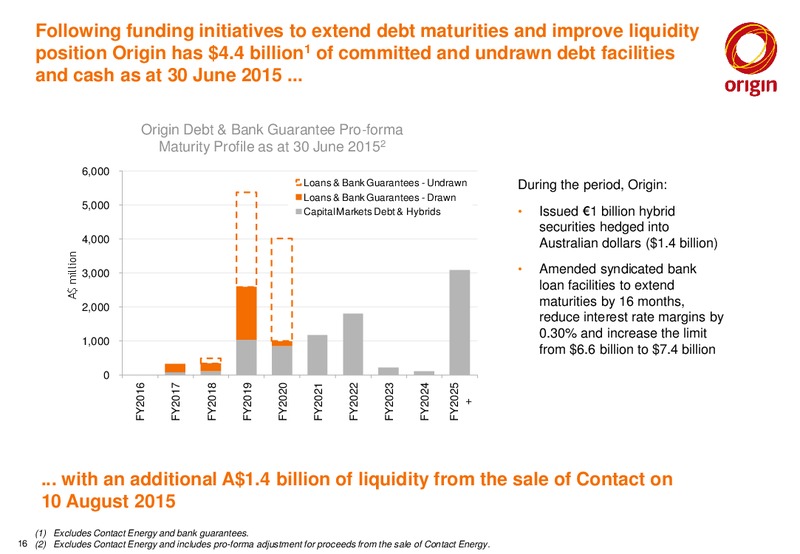
Following funding initiatives to extend debt maturities and improve liquidity position Origin has 4.4 billion1 of committed and undrawn debt facilities and cash as at 30 June 2015 ... Origin Origin DebtDebt & Bank&Guarantee Bank…
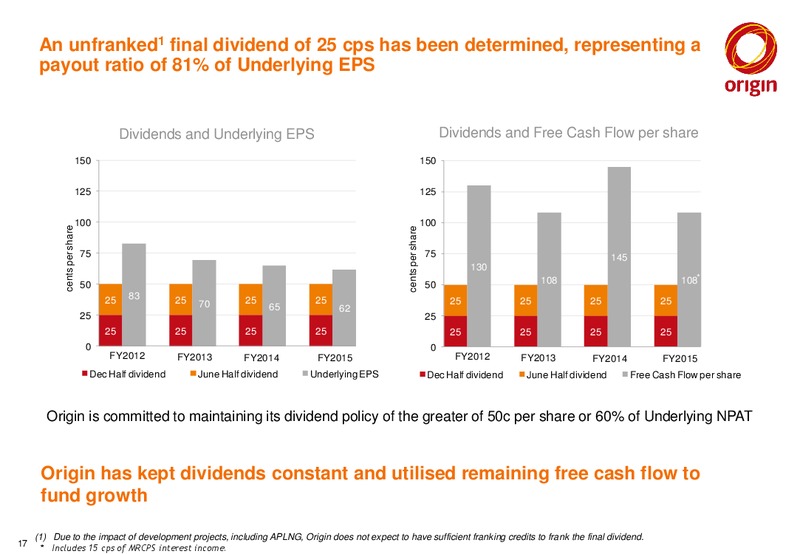
An unfranked1 final dividend of 25 cps has been determined, representing a payout ratio of 81% of Underlying EPS Dividends and Underlying EPS Dividends and Free Cash Flow per share 150 150 125 125 100 100 cents per share…
3. OPERATIONAL REVIEW Grant King, Managing Director 18
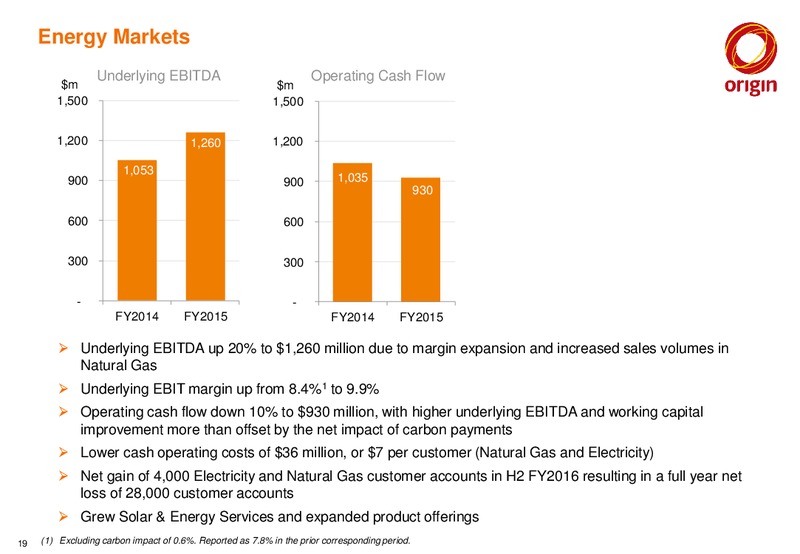
Energy Markets Underlying EBITDA Operating Cash Flow m m 1,500 1,500 1,200 1,260 1,200 1,053 900 900 1,035 930 600 600 300 300 - - FY2014 FY2015 FY2014 FY2015 Underlying EBITDA up 20% to 1,260 million due to margin…
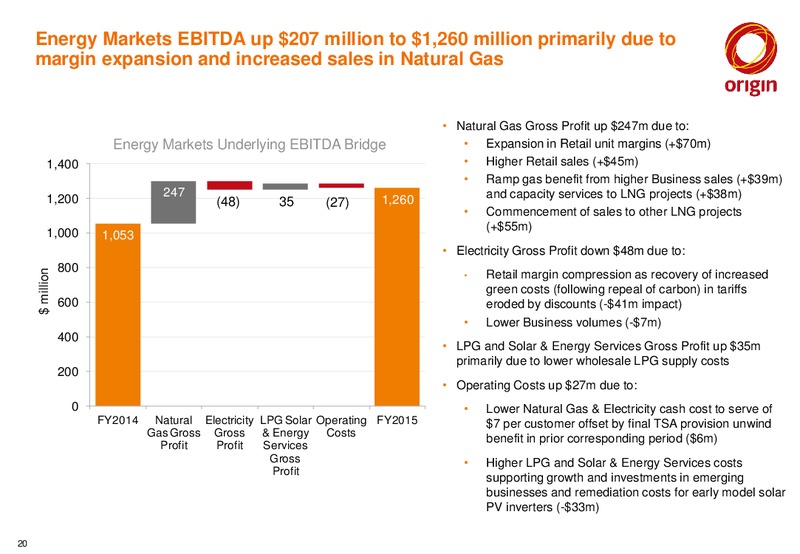
Energy Markets EBITDA up 207 million to 1,260 million primarily due to margin expansion and increased sales in Natural Gas Natural Gas Gross Profit up 247m due to: Energy Markets Underlying EBITDA Bridge Expansion in Retail unit…
Natural Gas Unit Gross Profit up 44% (1.10/GJ) as tariffs increased in line with rising east coast market prices while energy procurement costs decreased reflecting the benefits of ramp gas External Volumes Sold (PJ) FY2015 FY2014…
Origins flexible portfolio and gas transportation arrangements have allowed Origin to monetise available ramp gas in Queensland, preserving E&P production for future periods Energy Markets Sources and PJ Uses of Gas 250 Sources…
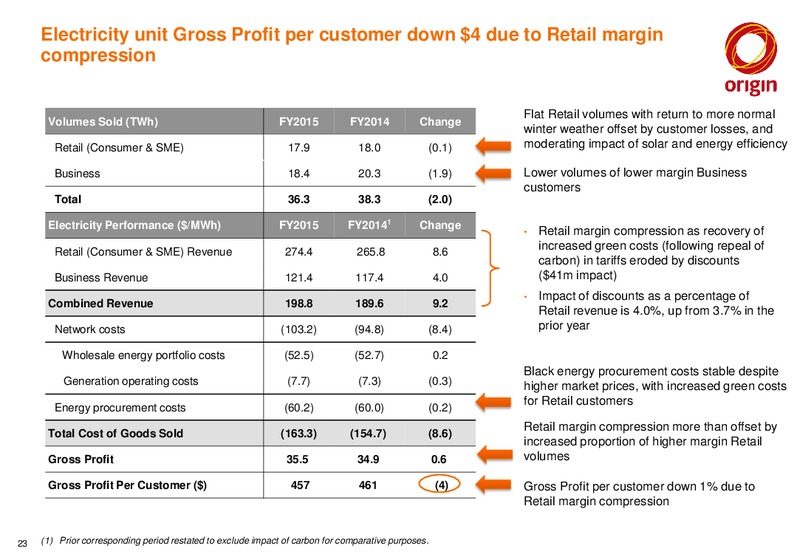
Electricity unit Gross Profit per customer down 4 due to Retail margin compression Flat Retail volumes with return to more normal Volumes Sold (TWh) FY2015 FY2014 Change winter weather offset by customer losses, and Retail…
20 Origins10black cost of energy remained stable despite an 8% increase in forward10contract prices and 13% increase in pool prices ... 0 FY14Average FY15Annual NEMFY14 Prices FY15 Origins Electricity Portfolio 0 FY14 Pool…
Origin delivered a net gain in customer accounts in the second half with the offering of competitive discounts following first half losses amid strong competition in VIC and increasing competition in NSW Origins Average Signed…
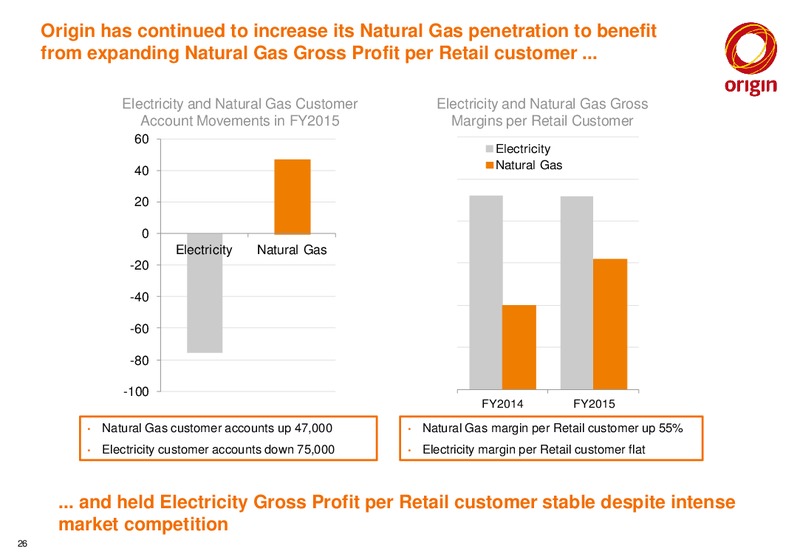
Origin has continued to increase its Natural Gas penetration to benefit from expanding Natural Gas Gross Profit per Retail customer ... Electricity and Natural Gas Customer Electricity and Natural Gas Gross Account Movements in…
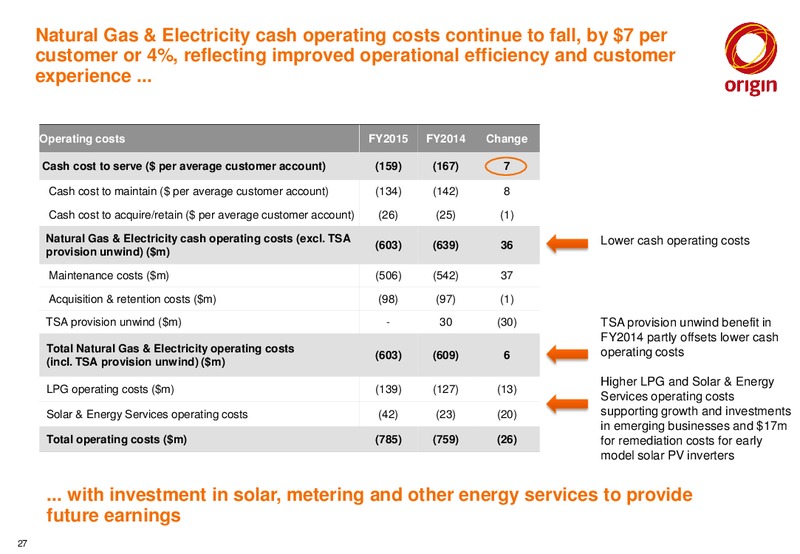
Natural Gas & Electricity cash operating costs continue to fall, by 7 per customer or 4%, reflecting improved operational efficiency and customer experience ... Operating costs FY2015 FY2014 Change Cash cost to serve ( per average…
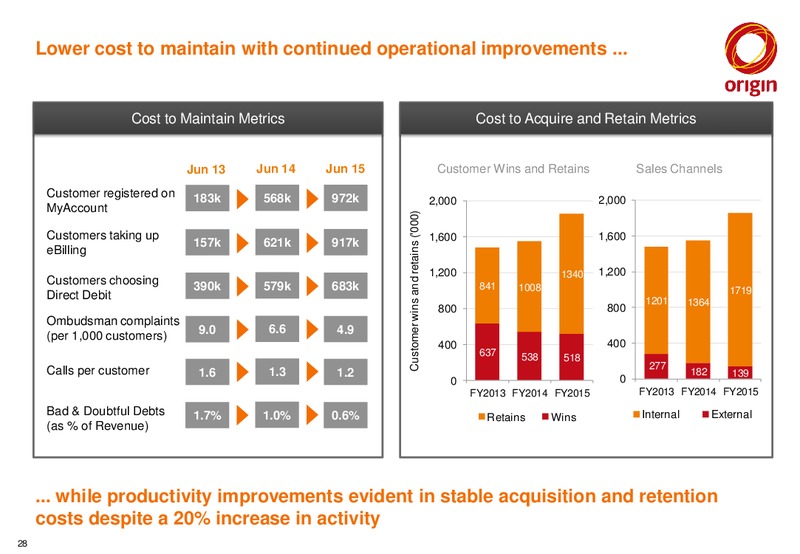
Lower cost to maintain with continued operational improvements ... Cost to Maintain Metrics Cost to Acquire and Retain Metrics Jun 13 Jun 14 Jun 15 Customer Wins and Retains Sales Channels Customer registered on 183k 568k 972k…
Origin continues to focus on building customer loyalty and trust, leveraging digital investments, creating simpler customer interactions and offering industry-leading hardship programs Customer Loyalty and Trust Customer centric…
Origin launched Solar as a Service in May, initiated battery trials and grew its established Acumen metering business ... Customer Analytics and Solar Energy Services Advanced Metering Battery trials underway and Leveraging…
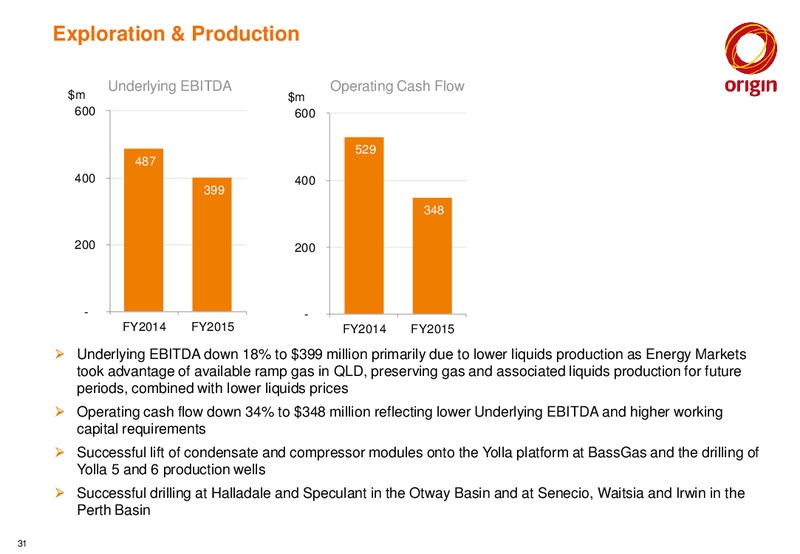
Exploration & Production Underlying EBITDA Operating Cash Flow m m 600 600 529 487 400 400 399 348 200 200 - - FY2014 FY2015 FY2014 FY2015 Underlying EBITDA down 18% to 399 million primarily due to lower liquids…
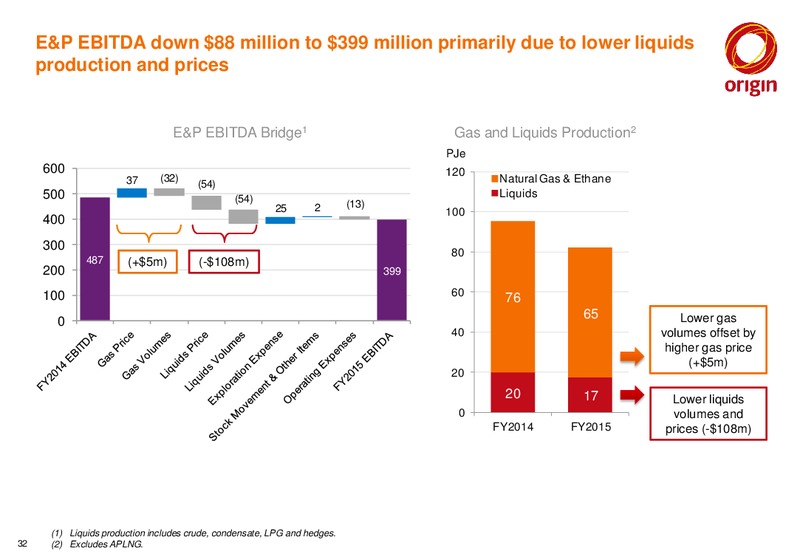
E&P EBITDA down 88 million to 399 million primarily due to lower liquids production and prices E&P EBITDA Bridge1 Gas and Liquids Production2 PJe 600 120 37 (32) Natural Gas & Ethane (54) 500 (54) Liquids 25 2 (13) 100 400…
New discoveries in the Otway and Perth basins provide development opportunities and partly offset a decrease in 2P reserves New bookings in 2P reserves of 66 PJe E&P 2P Reserves Bridge1 PJe 49 PJe Speculant discovery in the Otway…
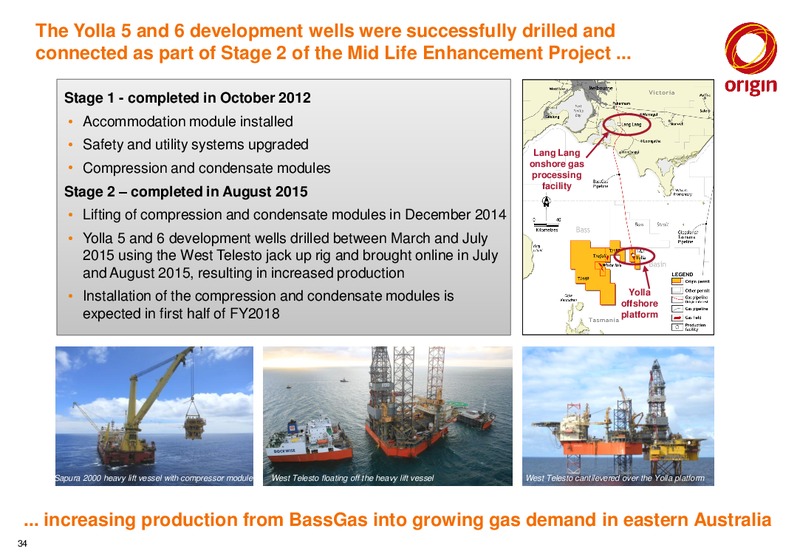
The Yolla 5 and 6 development wells were successfully drilled and connected as part of Stage 2 of the Mid Life Enhancement Project ... Stage 1 - completed in October 2012 Accommodation module installed Safety and utility systems…
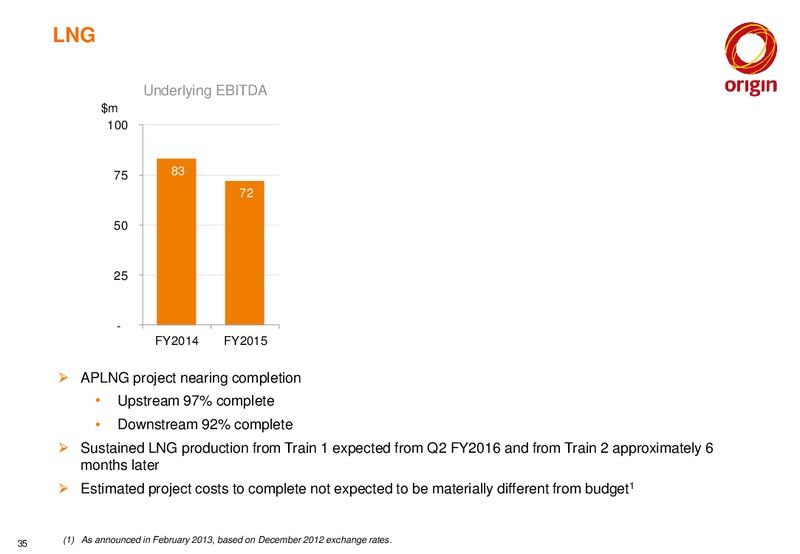
LNG Underlying EBITDA m 100 75 83 72 50 25 - FY2014 FY2015 APLNG project nearing completion Upstream 97% complete Downstream 92% complete Sustained LNG production from Train 1 expected from Q2 FY2016 and from…
Upstream Project Progress - 97% complete and on track FY2015 Upstream Operated Goals Actual Progress Plan Eurombah Creek GPF Train 1 mechanical completion Q3 Accomplished Condabri North GPF Train 2 mechanical completion Q3…
Despite a modest reduction in reserves, APLNG continues to have more than sufficient reserves to support domestic and LNG contracts 20,000 20,000 20,000 100% APLNG Reserves 1 PJ 20,000 1P reserves up 32% PJe to 6,059 PJe 15,000…
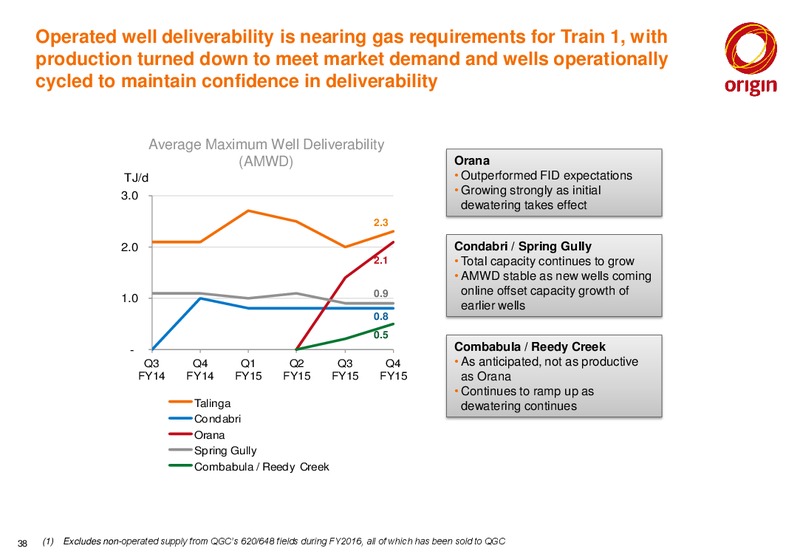
Operated well deliverability is nearing gas requirements for Train 1, with production turned down to meet market demand and wells operationally cycled to maintain confidence in deliverability Average Maximum Well Deliverability…
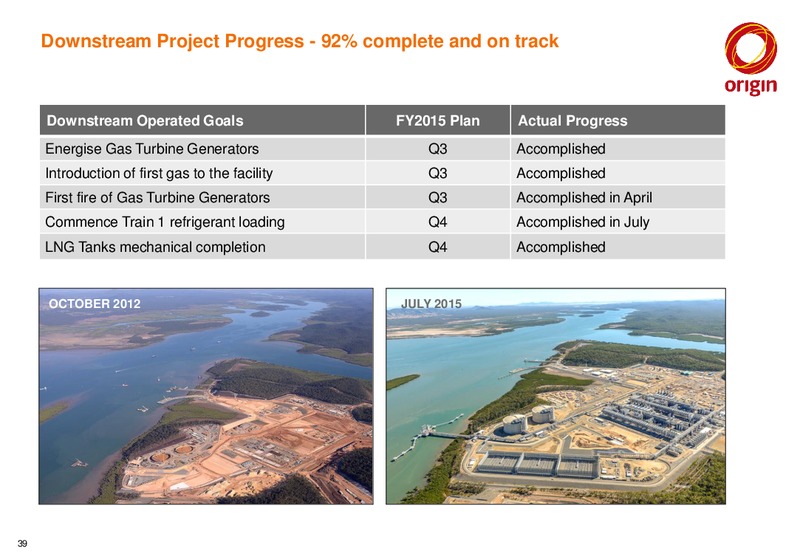
Downstream Project Progress - 92% complete and on track Downstream Operated Goals FY2015 Plan Actual Progress Energise Gas Turbine Generators Q3 Accomplished Introduction of first gas to the facility Q3 Accomplished First fire of…
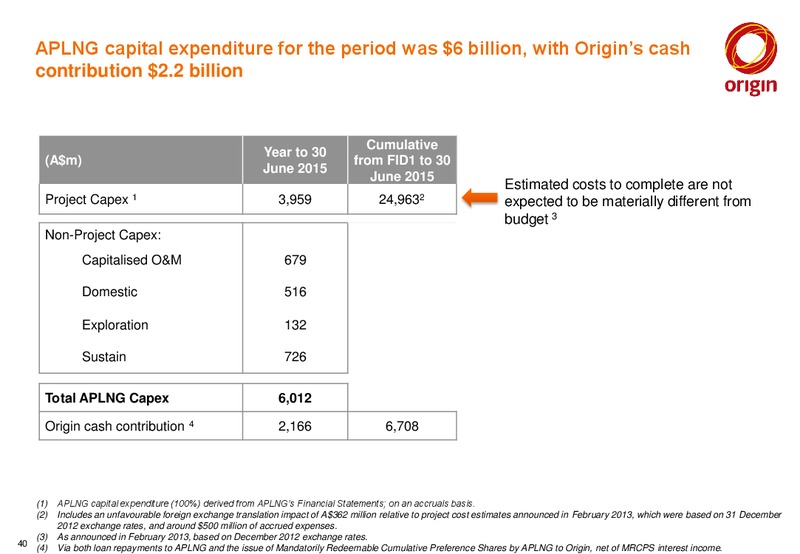
APLNG capital expenditure for the period was 6 billion, with Origins cash contribution 2.2 billion Cumulative Year to 30 (Am) from FID1 to 30 June 2015 June 2015 Estimated costs to complete are not Project Capex 1 3,959 24,9632…
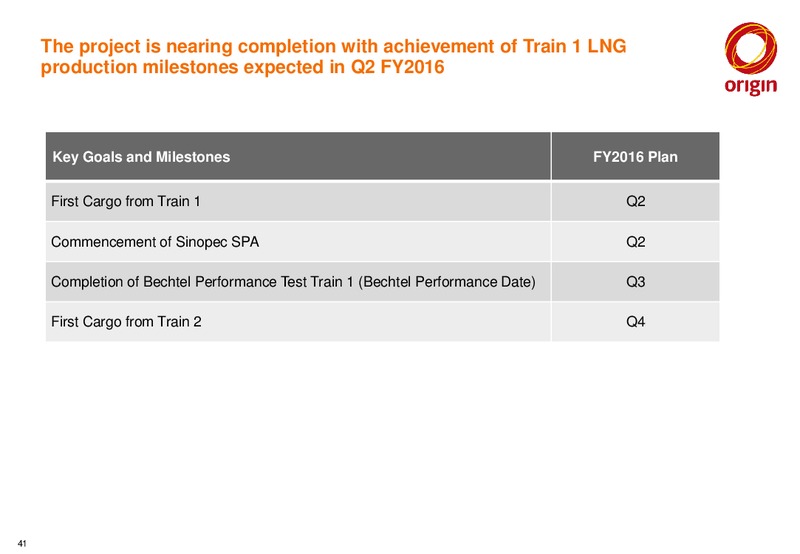
The project is nearing completion with achievement of Train 1 LNG production milestones expected in Q2 FY2016 Key Goals and Milestones FY2016 Plan First Cargo from Train 1 Q2 Commencement of Sinopec SPA Q2 Completion of…
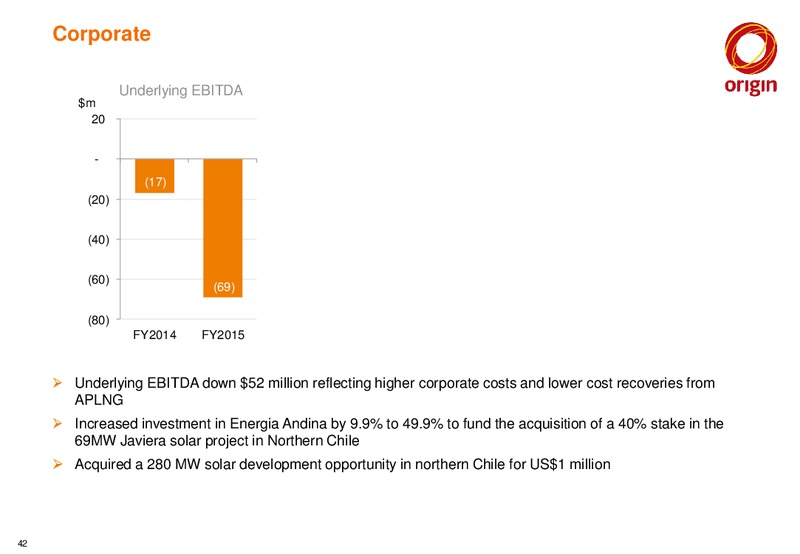
Corporate Underlying EBITDA m 20 - (17) (20) (40) (60) (69) (80) FY2014 FY2015 Underlying EBITDA down 52 million reflecting higher corporate costs and lower cost recoveries from APLNG Increased investment in…
4. PROSPECTS Grant King, Managing Director 43
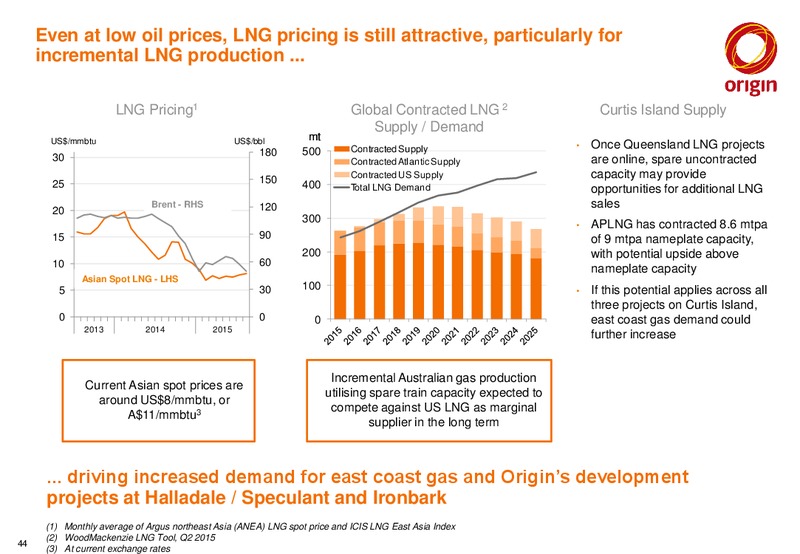
Even at low oil prices, LNG pricing is still attractive, particularly for incremental LNG production ... LNG Pricing1 Global Contracted LNG 2 Curtis Island Supply US/mmbtu US/bbl Supply / Demand US/mmbtu 180 US/bbl mt 30…
Diversion of gas from generation to the LNG market contributes to a short term tightening of the electricity market ... NEM Gas-Fired Generation1 Required Renewable Build To Meet Australias Post 2020 Renewables Build Equivalent…
The certainty provided by the setting of the new 33 TWh target has led to an increase in LREC prices, with any upward pressure towards penalty price further incentivising new build ... Black, LREC and Penalty Prices1 Renewable…
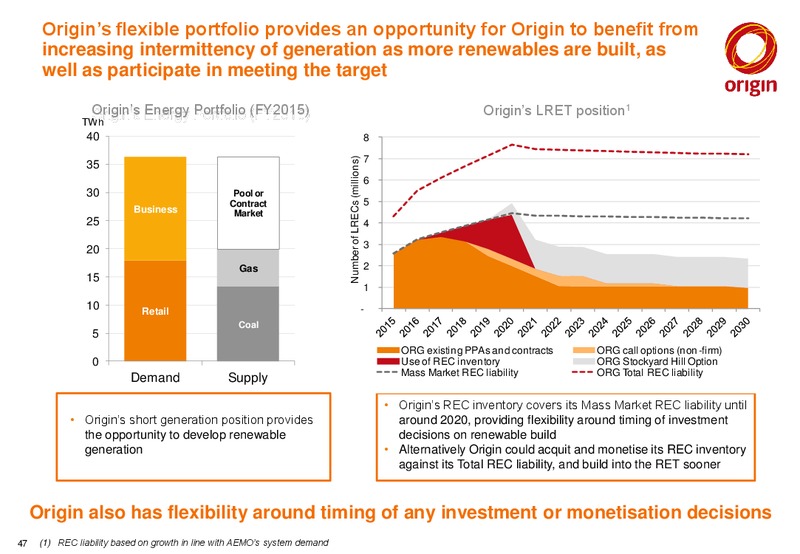
Origins flexible portfolio provides an opportunity for Origin to benefit from increasing intermittency of generation as more renewables are built, as well as participate in meeting the target Origins Energy Portfolio (FY2015) Origins…
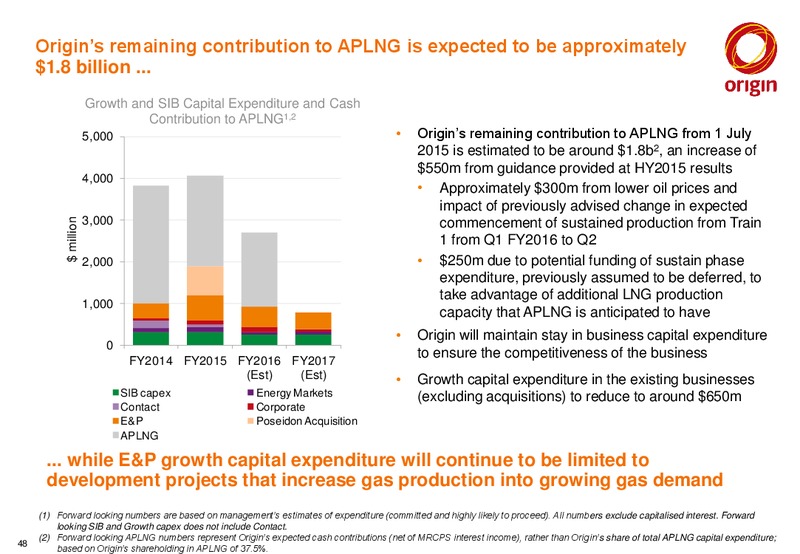
Origins remaining contribution to APLNG is expected to be approximately 1.8 billion ... Growth and SIB Capital Expenditure and Cash Contribution to APLNG1,2 5,000 Origins remaining contribution to APLNG from 1 July 2015 is estimated…
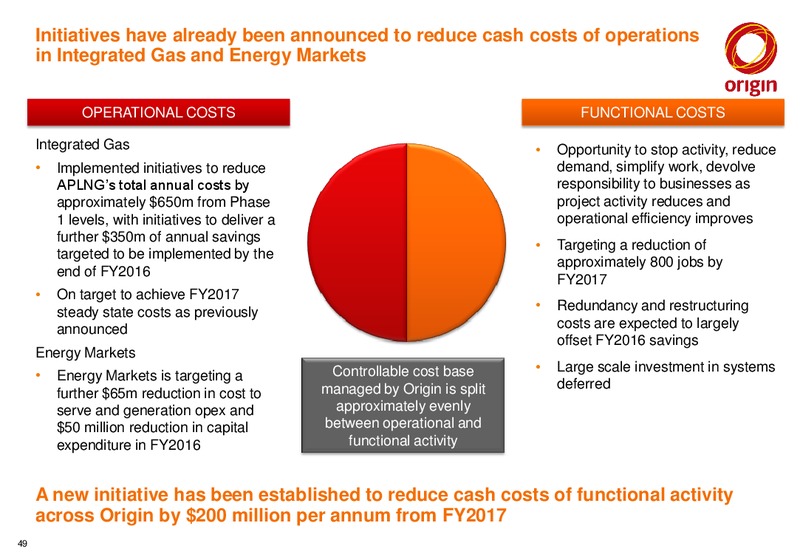
Initiatives have already been announced to reduce cash costs of operations in Integrated Gas and Energy Markets OPERATIONAL COSTS FUNCTIONAL COSTS Integrated Gas Opportunity to stop activity, reduce Implemented initiatives to…
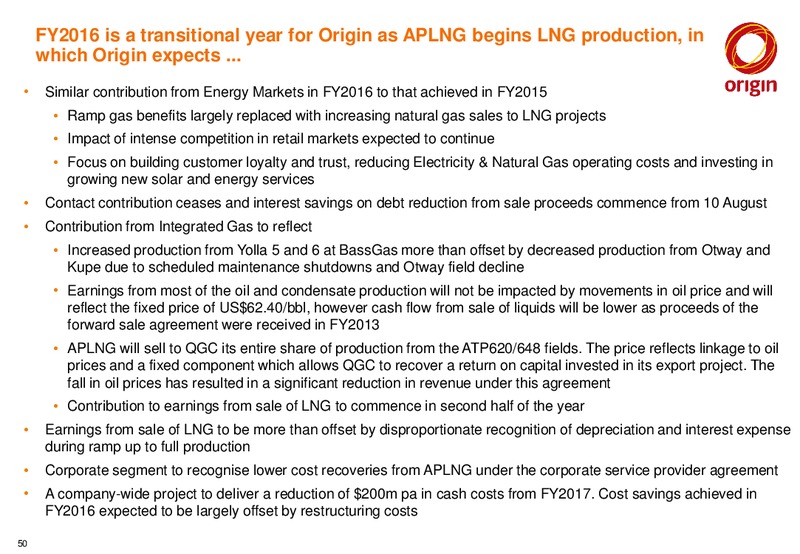
FY2016 is a transitional year for Origin as APLNG begins LNG production, in which Origin expects ... Similar contribution from Energy Markets in FY2016 to that achieved in FY2015 Ramp gas benefits largely replaced with increasing…
APLNG will have free cash flow available for distribution to its shareholders at approximately A55/bbl oil on average from FY2017 Brent Forward AUD and Spot Brent Curves Price (A/bbl)1 140 APLNG will have free cash flow 120…
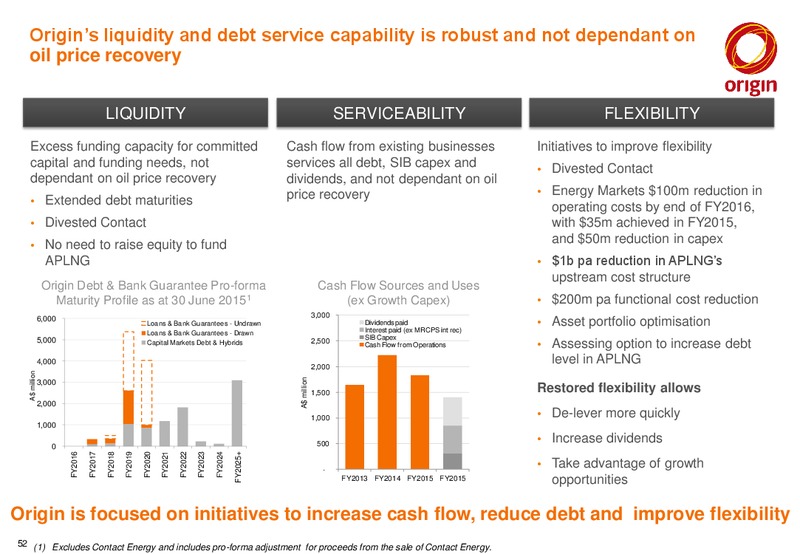
Origins liquidity and debt service capability is robust and not dependant on oil price recovery LIQUIDITY SERVICEABILITY FLEXIBILITY Excess funding capacity for committed Cash flow from existing businesses Initiatives to improve…
Important Information All figures in this report relate to businesses of the Origin Energy Group (Origin, or the Company), being Origin Energy Limited and its controlled entities, for the year ended 30 June 2015 (the period) compared…
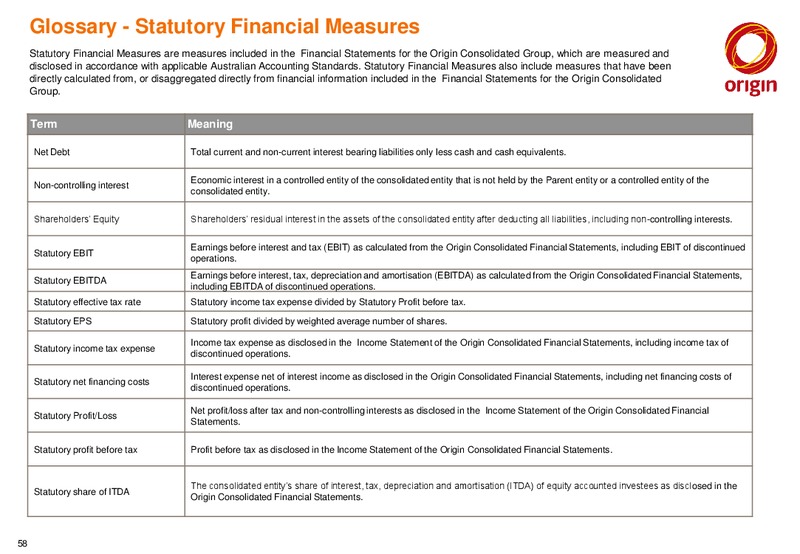
Glossary - Statutory Financial Measures Statutory Financial Measures are measures included in the Financial Statements for the Origin Consolidated Group, which are measured and disclosed in accordance with applicable Australian…
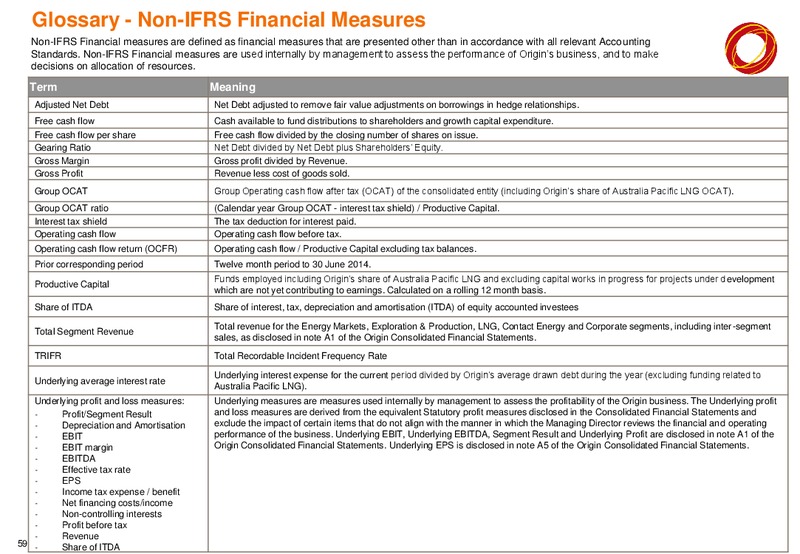
Glossary - Non-IFRS Financial Measures Non-IFRS Financial measures are defined as financial measures that are presented other than in accordance with all relevant Accounting Standards. Non-IFRS Financial measures are used internally by…
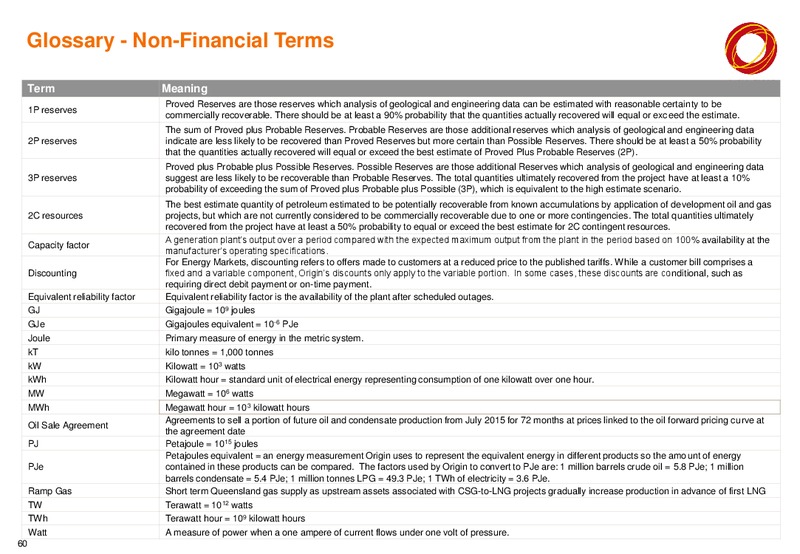
Glossary - Non-Financial Terms Term Meaning Proved Reserves are those reserves which analysis of geological and engineering data can be estimated with reasonable certainty to be 1P reserves commercially recoverable. There should be…
THANK YOU For more information Chau Le Group Manager, Investor Relations Email: chau.leoriginenergy.com.au Office: +61 2 9375 5816 Mobile: + 61 467 799 642 www.originenergy.com.au 61
 Loading...